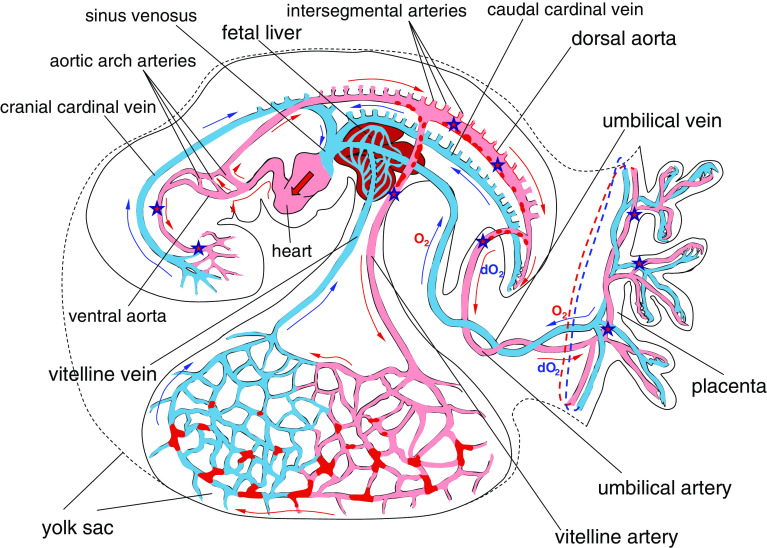
Fig. 3.
Scheme of blood circulation in the E9.5–E10.5 mouse conceptus. Red patches in the yolk sac denote Runx1+ or CD41+ hematopoietic cell clusters; red dots in the dorsal aorta, umbilical and vitelline arteries—HIACs; red arrows show the blood flow in the arteries and blue arrows in the veins. O2 and dO2 denote oxygenated and deoxygenated blood, respectively. Star symbols designate the conceptal territories where the earliest HSCs were detected

