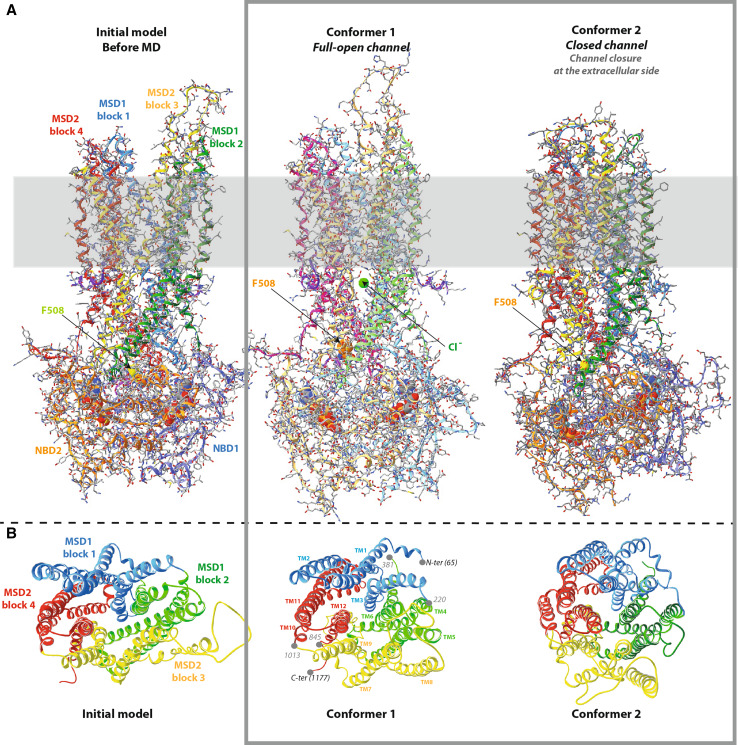
Fig. 1.
Comparison of the Sav1866-based CFTR model, before and after MD. A The MSD:NBD assembly. The CFTR model (encompassing aa 65–649 and 845–1,446) does not include the N-terminal, C-terminal and R regions, for which there is no template in the Sav1866 experimental 3D structure. The position of the lipid bilayer is symbolized in gray. The path of the polypeptidic chain can be followed with ribbons, colored according the architecture into domains (NBD1 light blue, NBD2 orange) or into blocks for the MSD (block 1 blue, block 2 green, block 3 yellow, block 4 red). ATP molecules are shown with solid spheres. At left the CFTR model before MD, closed at its cytosolic side (initial model). At the center full-open model of the CFTR channel (conformer 1). A ~15 Å upward movement of the region including F508 (shown in solid spheres) is observed, together with the creation of a large lateral tunnel, just under the membrane. A chloride ion is shown in green for illustration, at one of the entrances of this lateral tunnel, which is fully open and runs parallel to the membrane plane, from one side of the protein to the other (distance 47 Å). This lateral tunnel gives access to the main channel, which goes upward, perpendicularly to the membrane plane. At right closed form of the CFTR channel (closure at the extracellular part, conformer 2). B Ribbon representation of the MSD assembly. View of the same three conformers, which shows the four three-helix blocks of the MSDs from the extracellular side along the pseudo-binary axis and illustrates their displacement during MD. Positions 220 and 1,013 indicate the connections between blocks 1 and 2 and blocks 3 and 4, respectively. MSD1 runs from amino acid 65 to amino acid 381 and MSD2 from amino acid 845 to amino acid 1,177

