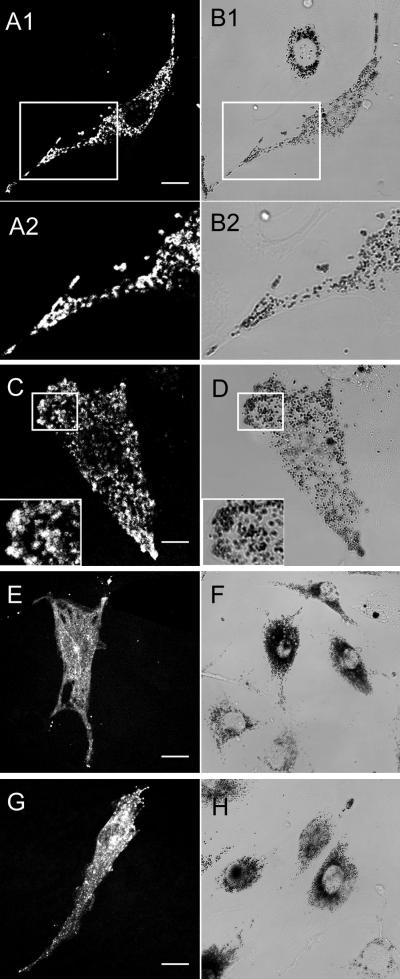
Figure 7.
MC MV and MC MVΔD, but not MC MVΔF and BR MV, colocalize with melanosomes. Shown are the distributions of various GFP-tagged myosin Va isoforms (A1, A2, C, E, and G), together with the distributions of black, end-stage melanosomes in brightfield (B1, B2, D, F, and H), in dilute melanocytes microinjected with MC MV (A1–B2; B1 and B2 are an enlargement of a portion of the image in A1 and A2), MC MVΔD (C and D plus insets), MC MVΔF (E and F), and BR MV (G and H). These cells represent examples where the fluorescence signals for the four GFP-tagged myosin Va isoforms were much stronger than usual. Bars, 11.5 μm (A1 and B1), 5.5 μm (C and D), 16.5 μm (E and F), and 13 μm (G and H).

