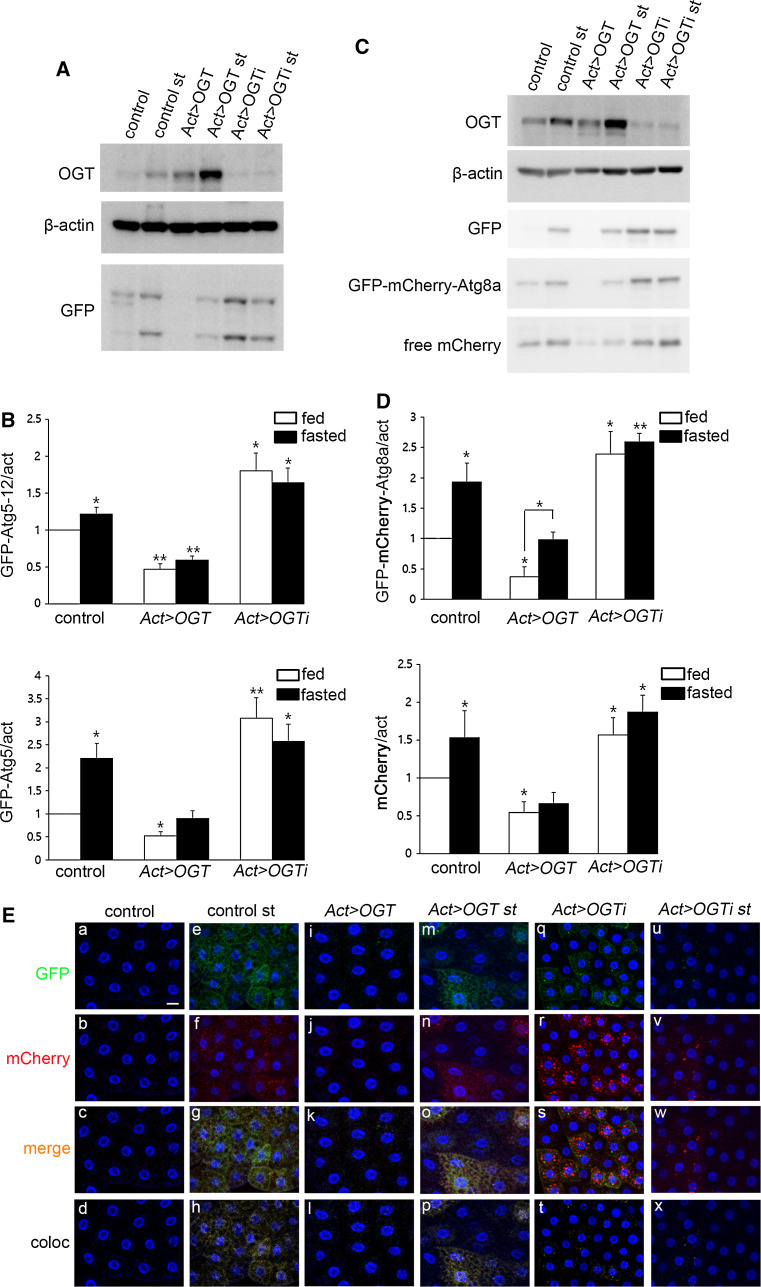
Fig. 2.
O-GlcNAc modification changes autophagy pathway protein expression. A Larval lysates from UAS-OGT and Act > OGT with or without fasting were analyzed by immunoblot with OGT, β-actin, and GFP antibodies. Because we used GFP-Atg5 to detect early structures of autophagy, we checked Atg5 expression by GFP antibody. B Quantification of GFP (*p < 0.05, **p < 0.01, Student’s t test). The data are represented as mean ± SE for four independent experiments. C Lysates from control, Act > OGT, and Act > OGTi larvae with or without fasting were analyzed by Western blot using OGT, β-actin, GFP, and mCherry antibodies. D Quantification of mCherry bands were performed by using Multi Gauge V3.1, mean ± SE, n = 4 (*p < 0.05, **p < 0.01, Student’s t test). E Early third-instar larval fat body images of each GFP-mCherry-Atg8a-expressing line. Practically no GFP-mcherry-Atg8a puncta are seen in fat body cells of well-fed control larvae (a–d) and OGT-overexpressing larvae (i–l). Dots positive for both mCherry and GFP appear in control cells (e–h) and OGT-overexpressing cells (m–p) upon fasting. Reduction of OGT results in the formation of mostly mCherry-positive dots during feeding (q–t), while the number of mCherry-positive puncta was reduced during fasting (u–x). a, e, i, m, q, u GFP channels (green). b, f, j, n, r, v mCherry channels (red). c, g, k, o, s, w Merged images. d, h, l, p, t, x Colocalized images. DAPI was used for nuclei staining (blue). Scale bar represents 20 μm

