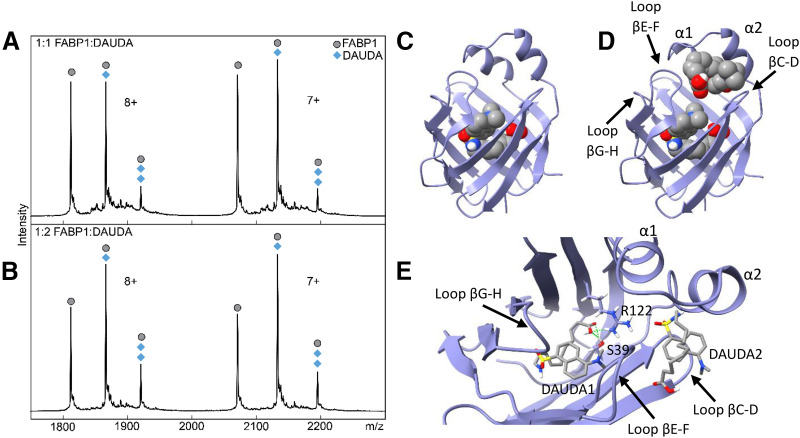
Fig. 4.
Native mass spectra and docking of DAUDA with hFABP1. Panels (A) and (B) show native mass spectra of a mixture of hFABP1 and DAUDA at (A) 1:1 (10:10 μM) and (B) 1:2 (10:20 μM) FABP1:DAUDA ratios. The mass of apo-FABP1 for each charge state (n+) is observed with additional m/z-shifted peaks corresponding to the molecular mass of one and two DAUDA (+434 and +868, respectively). Circle markers denote the apo form of the protein, whereas diamond markers denote peaks that correspond to DAUDA-FABP1 and DAUDA-FABP1-DAUDA complexes at the given charge state. Panels (C) and (D) show the structure of hFABP1 (PDB: 2LKK) (Cai et al., 2012) docked with one (C) and two (D) molecules of DAUDA. PDB files corresponding to panels (C) and (D) are included in Supplemental Material with captions included in S.13. Panel (E) shows a top-down view of the docked structure in (D). DAUDA1 corresponds to the DAUDA in center-bottom of the binding cavity. DAUDA1 interacts with sidechains from residues S39 and R122. DAUDA2 is located in the portal region in close proximity to the alpha helical domains.

