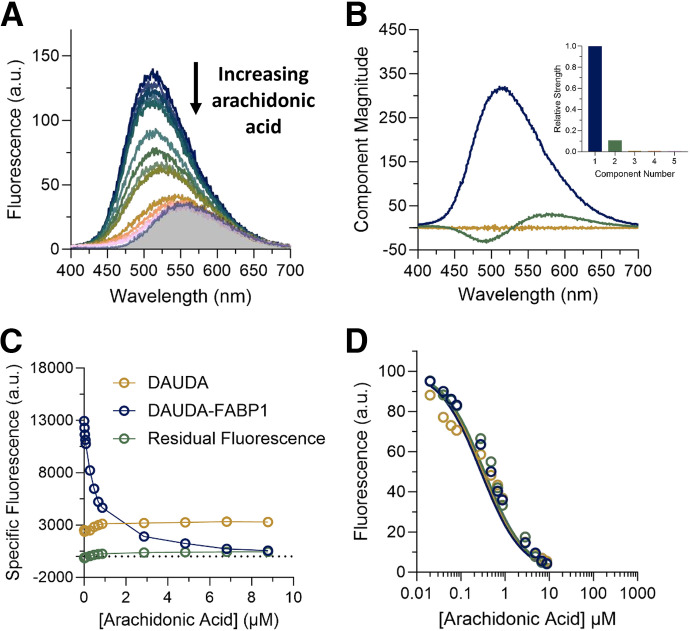
Fig. 5.
Displacement of DAUDA (0.5 μM) from FABP1 (0.3 μM) by increasing concentrations of arachidonic acid (0.02–8.8 μM). (A) The raw fluorescence spectra of the arachidonic acid titration are shown. Different colored spectra represent increasing concentrations of arachidonic acid from top (dark blue, 0 μM) to bottom (pink, 8.8 μM). The shaded area is the spectrum of 0.5 μM unbound DAUDA in buffer. (B) Spectral components identified by singular value decomposition (SVD) in the arachidonic acid titration in (A) are shown, scaled by their relative strength (singular values). Each spectral component reflects correlated changes in the data: the primary component (dark blue) reflects overall quenching of DAUDA fluorescence as AA is added, whereas the second component (green) reflects a red shift of fluorescence as DAUDA is displaced from FABP1 into solution. The inset is a scree plot showing the strength (singular value) of the first five spectral components from SVD analysis of the spectra in (A). (C) Relative change in the specific fluorescence of DAUDA bound to hFABP1 (dark blue) and DAUDA in solution (gold) with increasing arachidonic acid concentrations. (D) Decrease in DAUDA-FABP1 fluorescence with increasing AA concentration with fluorescence at a given AA concentration calculated from eq. 4. Solid lines indicate fits to a competitive binding model comprised of reactions 1–3 implemented in COPASI, which yielded a best-fit Kd value for AA as described in Materials and Methods. Fits to three replicate experiments done on separate days (dark blue, green, and gold) are shown. The resulting Kd parameter estimates are summarized in Table 1.

