Fig. 7.
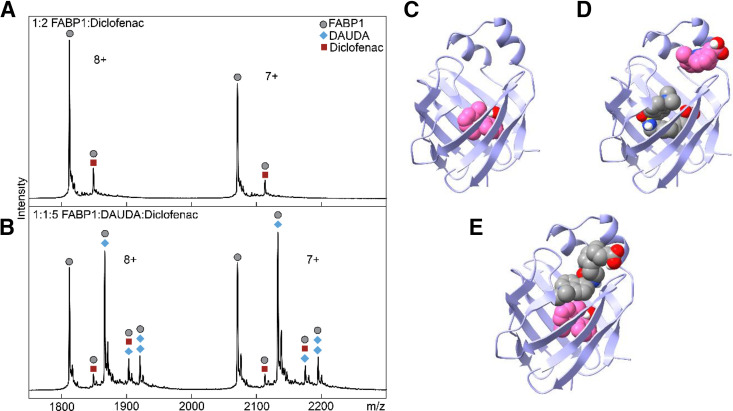
Characterization of the binding of diclofenac in the presence and absence of DAUDA to hFABP1 via native protein mass spectrometry and molecular docking. (A) Native mass spectrum of hFABP1 and diclofenac at a 1:2 (10:20 μM) hFABP1:diclofenac ratio. Circle markers represent the apo form of the protein, whereas square markers denote m/z-shifted peaks that correspond to diclofenac. (B) Native mass spectrum of hFABP1, DAUDA, and diclofenac at 1:1:5 (10:10:50 μM) ratio. The marker labels are the same as (A), with the addition of diamond markers that denote m/z-shifted peaks corresponding to the association of DAUDA. (C–E) Predicted structures of hFABP1 complexes showing potential binding orientations of singly bound diclofenac (C, pink) and diclofenac (pink) and DAUDA (gray) in complex with FABP1 (D and E). Docking studies were carried out using an NMR solution structure of holo-hFABP1 (PDB: 2LKK) (Cai et al., 2012) using AutoDock4. Ligands in (D) and (E) were docked sequentially, with DAUDA docked first in (D) and diclofenac docked first in (E). The binding orientations shown were the top scoring (lowest ΔGbinding) poses from 50 docking runs. PDB files corresponding to panels (C), (D), and (E) are included in Supplemental Material, with captions included in S.13.

