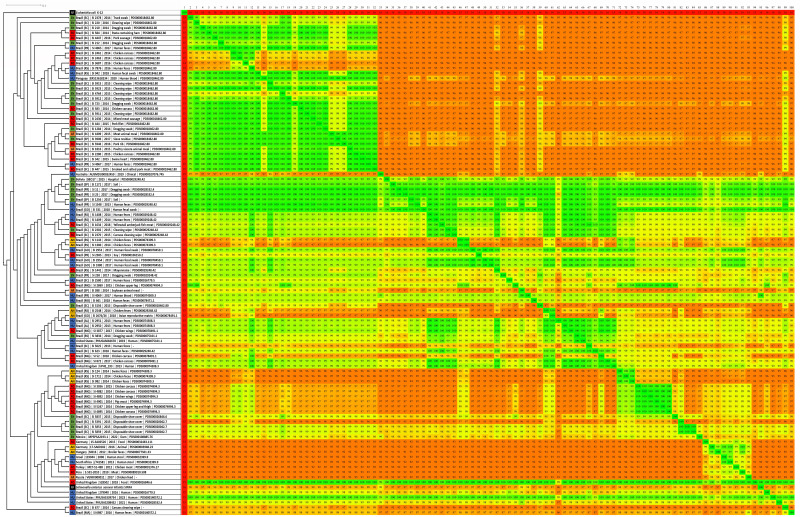
Figure 2. Fragmented genome phylogenetic tree based on the Gegenees analysis of 80 Brazilian and 18 non-Brazilian Salmonella Infantis draft genomes.
The differences in the level of similarity found among the strains analyzed are represented by green shades (higher percentages of similarities) to red shades (smaller similarity percentages). Similarity percentages are also demonstrated by the numbers inside each square, that represents the similarity percentage among two strains. Sources: food (FO; red), environmental (EN; green), human (HU; blue), animal (AN; yellow), animal feed (RF; orange). Reference genomes (RF; black): Salmonella Infantis SINFA and Escherichia coli K-12.

