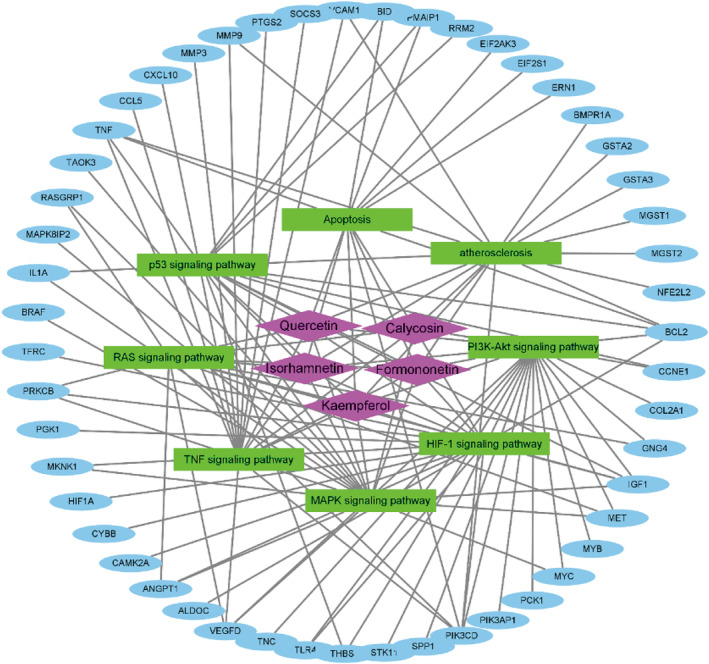
FIGURE 2.

The compound‐signalling‐target networks generated using Cytoscape_v3.8.0. The compounds, pathways, or targeted proteins were represented by nodes in these graphical networks, whereas the interactions between compounds, pathways, or targeted proteins were represented by edges.
