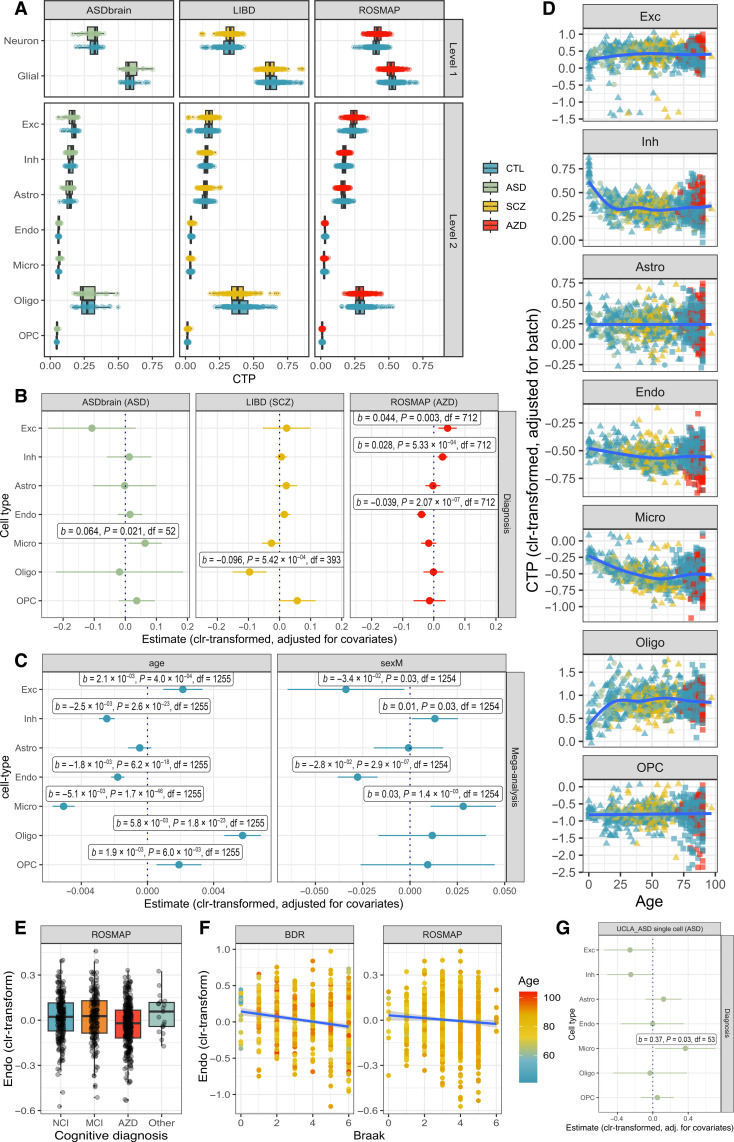
Fig. 3. Brain cell type shifts are observed across neuropsychiatric diagnoses, age, and sex.
(A) Boxplot of deconvolved brain CTPs, stratified by study. (B) Diagnosis coefficients (±95% CI) from linear models of brain CTP (clr-transformed) ~ diagnosis + age + age2 + sex + batch. This model was run within each study (UCLA_ASD, n = 58; ROSMAP, n = 715; LIBD, n = 402). Labeled results indicate nominally-significant results (P ≤ 0.05). (C) Age effect coefficients (±95% CI) from linear models of brain CTP (clr-transformed) ~ diagnosis + age + sex + batch; coefficients for sex from linear models of brain CTP (clr-transformed) ~ diagnosis + age + age2 + sex + batch. This model was run as a mega-analysis including all participants (with and without neuropsychiatric diagnoses) across all studies (n = 1270). (D) Age trajectories of brain CTPs (clr-transformed) aggregating across all studies, correcting for batch effects. (E) Boxplot of endothelial cell proportion (clr-transformed) by final clinical consensus cognitive diagnosis: no cognitive impairment (NCI) versus mild cognitive impairment (MCI) versus Alzheimer’s disease (AZD) versus other primary cause of dementia (Other). (F) Scatterplot of endothelial cell CTP (clr-transformed) versus Braak score (representing histopathological severity of Alzheimer’s disease), demonstrating replication across the ROSMAP and BDR datasets. (G) Increased microglia are replicated in ASD using snRNA-seq count data (n = 60). ASD diagnosis coefficients (±95% CI) from linear models of brain CTP (clr-transformed) ~ diagnosis + age + age2 + sex + brain region.

