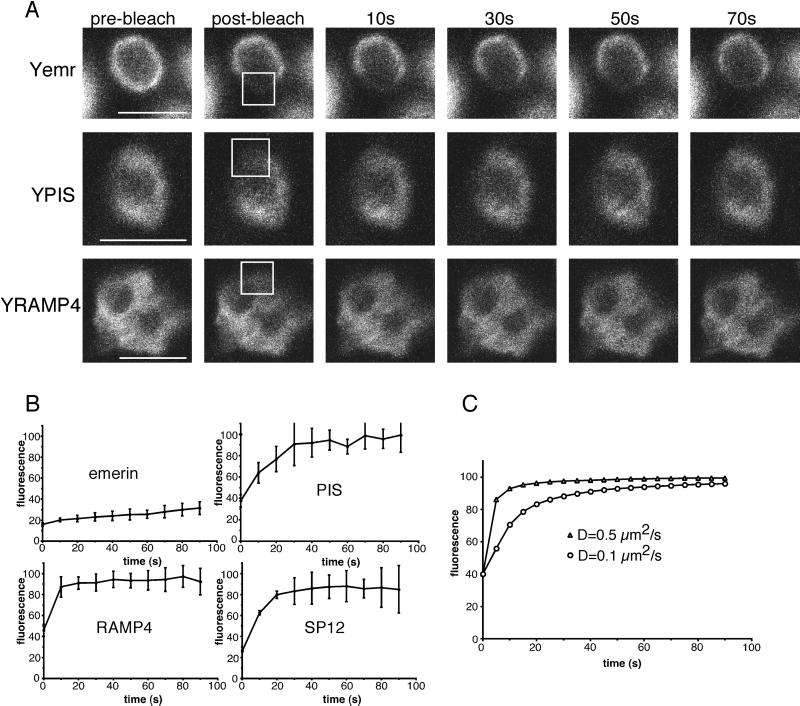
Figure 7.
Concentration of RER membrane markers in the cell body does not require immobilization. (A) Photobleaching experiments were performed as in Figure 6. Bleached regions are indicated with boxes. The examples shown are YFP-emerin (Yemr), YFP-PIS (YPIS), and YFP-RAMP4 (YRAMP4). The bleached region of PIS and RAMP4 is less distinct because they are mobile and proteins move in and out of the region during bleaching. (B) Quantitation of bleaching experiments was performed as in Figure 6, except different numbers of experiments were used for the different proteins. For emerin, six experiments were averaged, for PIS and RAMP4 three experiments, and for SP12 two experiments. (C) Simulations of FRAP in two dimensions were performed using Virtual Cell (http://www.nrcam.uchc.edu/). Diffusion coefficients of 0.5 μm2/s (which is a standard value for membrane proteins in the ER; Nehls et al., 2000) and 0.1 μm2/s were used to model recovery at the center of a 3 × 3-μm2 bleach area. The total computational area was 20 × 20 μm2, and calculations were performed using a 0.4-μm mesh size and a 0.1-s time step. Scale bars, 5 μm.

