Abstract
Supraspinal brain regions modify nociceptive signals in response to various stressors including stimuli which elevate pain thresholds. The medulla oblongata has previously been implicated in this type of pain control, but the neurons and molecular circuits involved have remained elusive. Here we identify catecholaminergic neurons in the caudal ventrolateral medulla that are activated by noxious stimuli in mice. Upon activation, these neurons produce bilateral feed-forward inhibition that attenuates nociceptive responses through a pathway involving the locus coeruleus and noradrenalin in the spinal cord. This pathway is sufficient to attenuate injury-induced heat allodynia and is required for counter-stimulus induced analgesia to noxious heat. Our findings define a component of the pain modulatory system that regulates nociceptive responses.
Introduction
Painful stimuli are detected by peripheral nociceptive neurons, which subsequently transmit signals to higher brain centers to produce appropriate sensory percepts and to regulate physiological and behavioral responses. These responses can be modulated by descending circuits, which involves modification of the activity of spinal cord (SC) neurons1-3. These descending circuits often produce context-dependent effects, where modulation of pain likely has an adaptive advantage. For example, pain responses are suppressed during goal-directed activity such as feeding4,5, whereas injury can lead to facilitation of pain, which may be adaptive to allow optimal tissue recovery and regeneration6.
The modulation of pain is thought to be driven by several brain nuclei. About 50 years ago, it was established that focal electrical stimulation of certain midbrain regions could elicit analgesia7,8. This led to studies that eventually showed that spinally projecting neurons in the ventral locus coeruleus (LC) and in the rostral ventral medulla (RVM) release noradrenaline (NA) and serotonin, respectively, in the SC, and these modulate the activity of nociceptive spinal circuits9. In addition to NA and serotonin, the LC and RVM release other transmitters that affect nociceptive responses, and other brain nuclei can also alter nociceptive signaling, including through corticospinal and bulbo-spinal pathways10-13. With regard to the LC, output from ventral areas evokes antinociceptive responses through SC projections, whereas dorsal areas induce pronociceptive responses through forebrain connections14,15. However, not all inputs to the LC that mediate pain control are well defined16,17.
In addition to the RVM and LC, the ventral lateral medulla (VLM) region is an important supraspinal center implicated in pain control2. Broadly defined, the VLM region consists of a number of subregions containing heterogenous neurons in the ventrolateral quadrant of the medulla oblongata. Noxious stimulation leads to cfos expression in the VLM18,19. In addition, electrical stimulation of the VLM20, glutamate and GABA agonist micro-injections into this region, elicit analgesia21,22, and lesioning of the VLM affects nociceptive responses23. These findings suggest that the broad VLM region regulates nociception, but the neurons mediating this process are unknown. In addition, follow-up studies suggest there may be direct connections between the VLM and spinal cord24 whereas other studies report indirect connections13. These opposing results likely arose because in these studies different classes of neurons were traced. In addition, the relationships of these neurons with the effects of VLM stimulation was not established. Altogether, previous studies suggest the VLM is a center for pain control, but the exact molecular identity and circuits involved remain undetermined.
Here we defined a population of noradrenergic neurons that are also glutamatergic in the VLM which are activated by painful stimuli and demonstrate that these neurons are synaptically connected to the LC. Via the LC, VLM neurons produce spinal-cord mediated control of nociceptive responses. Our findings reveal molecular detail for a previously unappreciated circuit for pain control. Additionally, we provide evidence for a role of the VLM–LC pathway in counter-stimulus induced analgesia.
Results
Catecholaminergic VLM neurons are activated by noxious stimuli
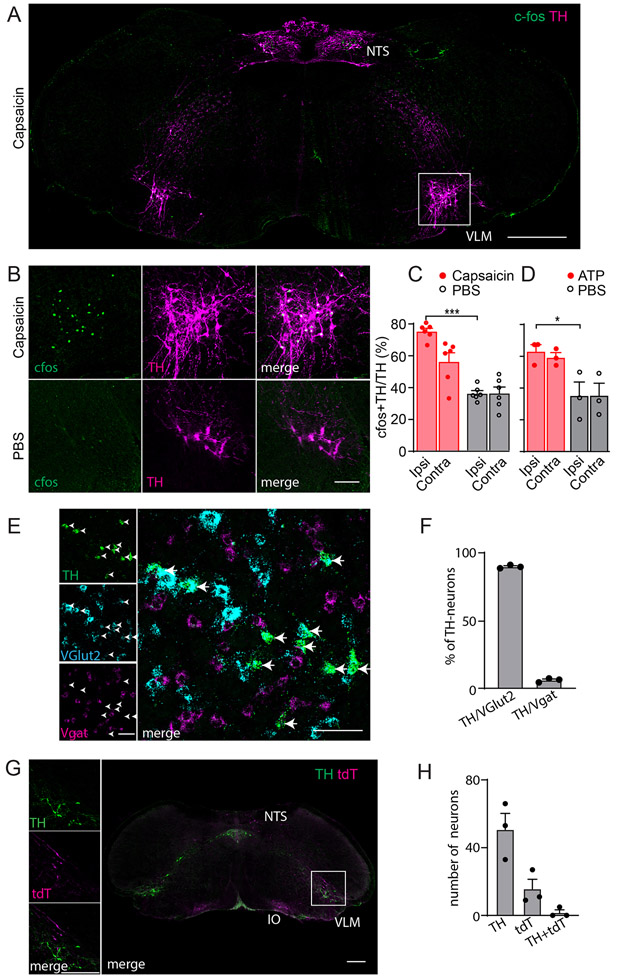
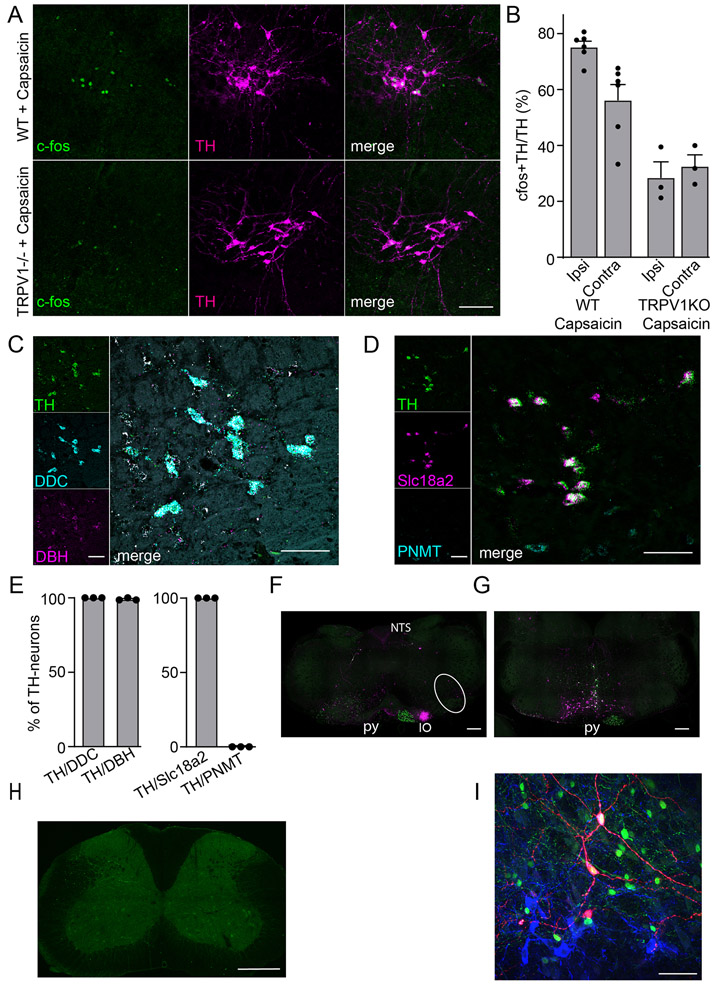
Previously, it was reported that, after noxious stimulation, neurons in the caudal VLM (cVLM) express the marker of cell activation, cfos18,19. Using application of the potent pain inducing agent capsaicin, we were able to replicate these findings showing a select group of neurons are activated by pain (Figure 1AB). Consistent with these neurons being specifically capsaicin activated, capsaicin administration in Trpv1-null animals failed to activate these neurons (Extended Data Figure 1AB). Intriguingly, despite using a unilateral stimulus, we found that increased cfos staining was bilateral, suggesting that the cVLM receives both ipsilateral and contralateral inputs (Figure 1C). In addition, similar to the effects of capsaicin, intraplantar injection of the pain inducing agent ATP resulted in cfos expression in the cVLM (Figure 1D). The molecular identity of these pain-activated neurons was unknown, and we wondered whether they might belong to a particular class. Based on their location in the ventral lateral part of the medulla (Bregma ~-7.7 to -7.9 mm), we reasoned that they might be catecholaminergic A1-neurons25. Therefore, we performed double label immunohistochemistry with antibodies against cfos and tyrosine hydroxylase (TH). Results from these studies revealed that the majority of TH-positive VLM neurons stained for cfos (Figure 1AB), and hereafter, we refer to these neurons as VLMTH neurons. To characterize cVLMTH neurons further we performed multi-label ISH to determine whether they are either excitatory or inhibitory and to test whether they express genes required for catecholamine synthesis. Figure 1EF shows that almost all cVLMTH neurons express the glutamate transporter Vglut2, and we found that these neurons express genes that are required for production of NA (TH, DDC, and DBH) but not adrenalin (PNMT was absent). In addition, the monoamine synaptic transporter Slc18a2 was present in these neurons (Extended Data Figure 1C-E). To investigate whether SC projection neurons target cVLMTH neurons we performed anterograde tracing studies with AAV1-CAG-cre virus injected into the SC of Ai9 reporter mice26,27. We predicted that, if VLMTH neurons are post-synaptic to spinal cord projection neurons, AAV1-cre would be transferred anterograde and lead to expression of tdT-fluorescent reporter in VLMTH neurons. Although we observed tdT-positive cells adjacent to VLMTH neurons, almost no double-labeled neurons were observed (Figure 1GH). Despite not observing anterograde transfer of AAV1 to VLMTH-neurons, we found labeled neurons in the RVM, the inferior olivary complex, and the cortex, using this technique (Extended Data Figure 1FG)28,29, confirming that this tracing technique is capable of labeling the post-synaptic partners of spinal cord projection neurons. Additionally, we used rabies virus tracing to investigate whether neurons in the SC are presynaptic to cVLMTH-neurons. Consistent with anterograde studies, we did not find rabies labeled neurons in the spinal cord and found neurons surrounding the cVLM which may be presynaptic (Extended Data Figure 1HI). Taken together our results show that noxious stimuli activate a relatively uniform class of excitatory noradrenergic neurons in the cVLM that are not post-synaptic to spinal cord projection neurons.
Figure 1. The cVLMTH, a brainstem nucleus activated by capsaicin.
A-C. Immunostaining for cfos in the caudal medulla of mice where capsaicin was applied unilaterally to the hind-paw (A) revealed TH+ neurons positive for cfos in the cVLM. B. Magnified view (see boxed area in A) of the cVLM showed that almost all TH-labeled neurons were cfos-positive after administration of capsaicin and few TH-neurons were cfos-labeled after saline treatment. Scale bars: 500 μm for coronal sections and 50 μm for magnified field images. CD. Quantification of the increase in the percent of cfos+TH+ to TH+ neurons after capsaicin (C) and ATP (D) treatment compared to PBS controls; p<0.0001, n=6 mice for capsaicin and p=0.042, n=3 mice for ATP,two-sided unpaired t-testdata are presented as mean ± SEM (Capsaicin ipsilateral 341/452, Capsaicin contralateral 219/404, PBS ipsilateral 154/440, PBS contralateral 147/371; ATP ipsilateral 145/233, ATP contralateral 142/241, PBS ipsilateral 83/229, PBS contralateral 74/208). E. Multilabel ISH of cVLMTH neurons revealed that the majority of these neurons express VGlut2 (Slc17a6). Scale bars: 50 μm. F, Quantification of the expression of Vglut2 and Vgat (Slc32a1) with TH; from 255 TH+-neurons there were 229 TH-Vglut2+, 14 TH-Vgat+-cells, n=3 mice, data are presented as mean ± SEM. G. Using spinal cord injection of AAV1-hSyn-Cre in Ai9 reporter mice, spinal cord anterograde neurons (labeled red-tdT) were observed adjacent to TH-neurons in the cVLM (boxed area magnified in left panels). Neurons in the inferior olive complex (IO) and nucleus of the solitary tract (NTS) were also labeled with this technique. Scale bars: 500 μm for coronal sections and 50 μm for magnified field images. H. Quantification of labeled anterograde neurons,n= 3 mice (TH+ 152, tdTomato+ 47 and TH+tdTomato+ 5). Data are presented as mean ± SEM.
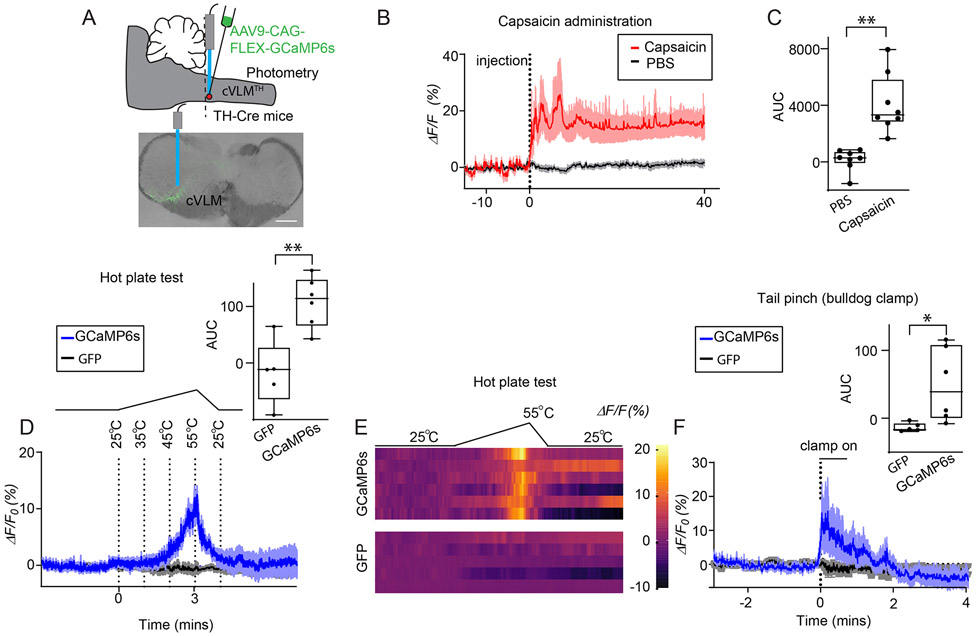
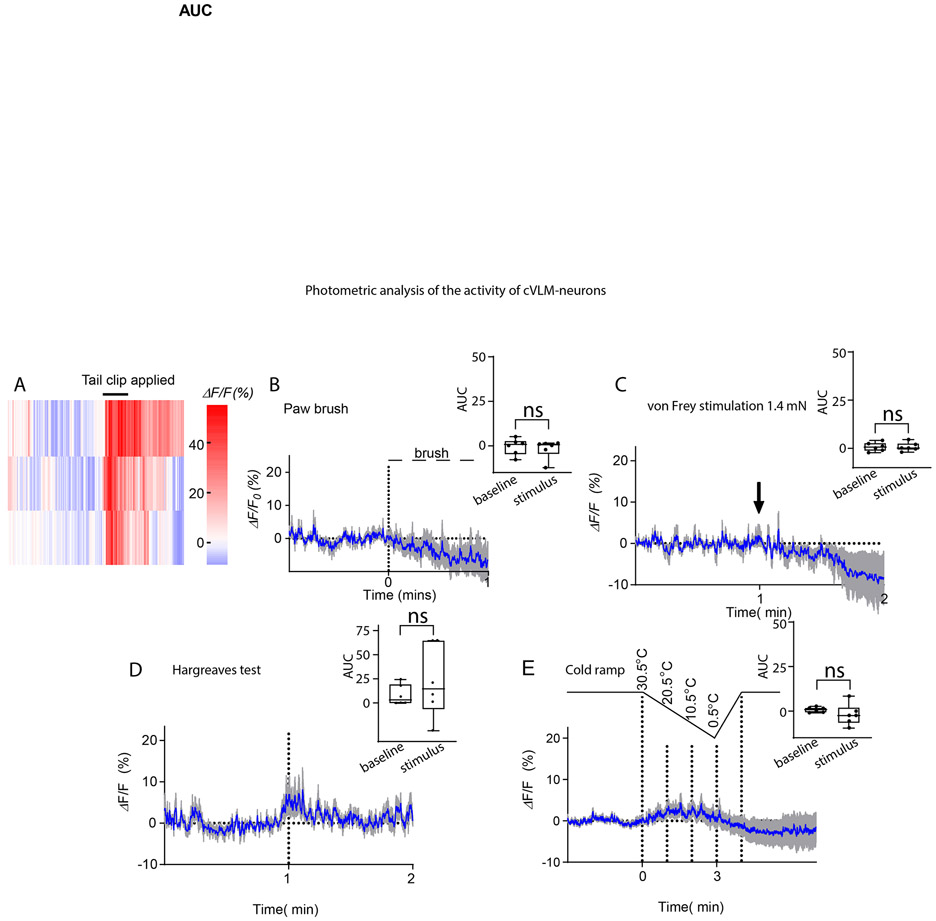
Since the cfos-expression technique does not readily allow analysis of many types of stimuli, we turned to in vivo fiber photometry to probe calcium responses in VLMTH neurons. TH-Cre mice were injected with AAV9-CAG-FLEX-GCaMP6s virus into the cVLM to monitor cellular activity of cVLMTH neurons in awake behaving mice (Figure 2A). We hypothesized that since these neurons are activated by capsaicin, they might also be activated by other noxious stimuli. Therefore, we challenged animals with several noxious and innocuous stimuli. Consistent with our hypothesis, we observed increased intracellular calcium in cVLMTH neurons upon injection of capsaicin, challenge with noxious heat, and noxious mechanical pinch (Figure 2B-F and Extended Data Figure 2A). Calcium influx sharply increased when hot plate temperatures started to reach the noxious heat threshold of mice and declined when temperature decreased (Figure 2DE). No change in fluorescent signal was detected in control mice injected with AAV2-DIO-GFP. In contrast to hot plate stimulation, the mild noxious heat stimulation produced by the Hargreaves and cold-plantar tests (transient localized subject terminated thermal stimuli) as well as innocuous mechanical elicited minimal changes in calcium (Extended Data Figure 2). Since the signal for these measurements come from a small number of cVLMTH neurons, a potential limitation of this technique is that responses of neurons, we could measure, are below the threshold of this method. Nonetheless, our results show that cVLMTH neurons are preferentially activated by noxious stimuli.
Figure 2. cVLMTH neurons are activated by noxious stimuli.
A. Procedures used to probe intracellular calcium responses of cVLMTH neurons and a representative image (approx. position shown by dotted line) of GCaMP6s expression (lower panel), scale bar 500 μm. B. Averaged in vivo fiber photometry results from cVLMTH neurons upon stimulation with capsaicin (red; injected into hind-paw) and saline (grey), n=8 mice, data are represented as mean results (red) ± SEM (shadow). For ΔF/F analysis, a least-squares linear fit to the 405 nm signal to align it to the 470 nm signal was first applied. The resulting fitted 405 nm signal was then used to normalize the 473 nm as follows: ΔF/F = (473 nm signal – fitted 405 nm signal)/fitted 405 nm signal. C. Area under the curve (AUC) quantification showed that capsaicin treatment significantly altered calcium responses compared to PBS injected controls; p=0.0025, n=8 mice, two-sided paired t-test. D. Responses to heat challenge on a hot plate show intracellular calcium increased in cVLMTH neurons in the noxious temperature range, averaged responses ± SEM, n=6 GCaMP6s mice (blue) and n=5 GFP control mice (black traces). Upper panel, quantification of the AUC for measurements are shown to the right and compared to those from mice injected with AAV2-DIO-GFP, GCaMP6s responses were significantly different from GFP responses, p= 0.0026, two-sided unpaired t-test. Heatmap traces from 6 individual animals to heat challenge and for comparison changes in fluorescence observed in cVLMTH neurons expressing GFP-expressing control animals (lower two traces). F. Calcium responses to bulldog clamp on the tail, averaged responses ± SEM, n=6 GCaMP6s mice (blue) and n=5 GFP control mice (black traces). Upper panel, quantification of the AUC for measurements are shown to the right and compared to those from mice injected with AAV2-DIO -GFP, GCaMP6s responses were significantly different from GFP responses, p= 0.031, two-sided unpaired t-test. Box chart legend in C, D, F: box is defined by 25th, 75th percentiles, whiskers are determined by maximum and minimum, horizontal line represents the mean.
Activation of cVLMTH neurons suppresses nociceptive responses
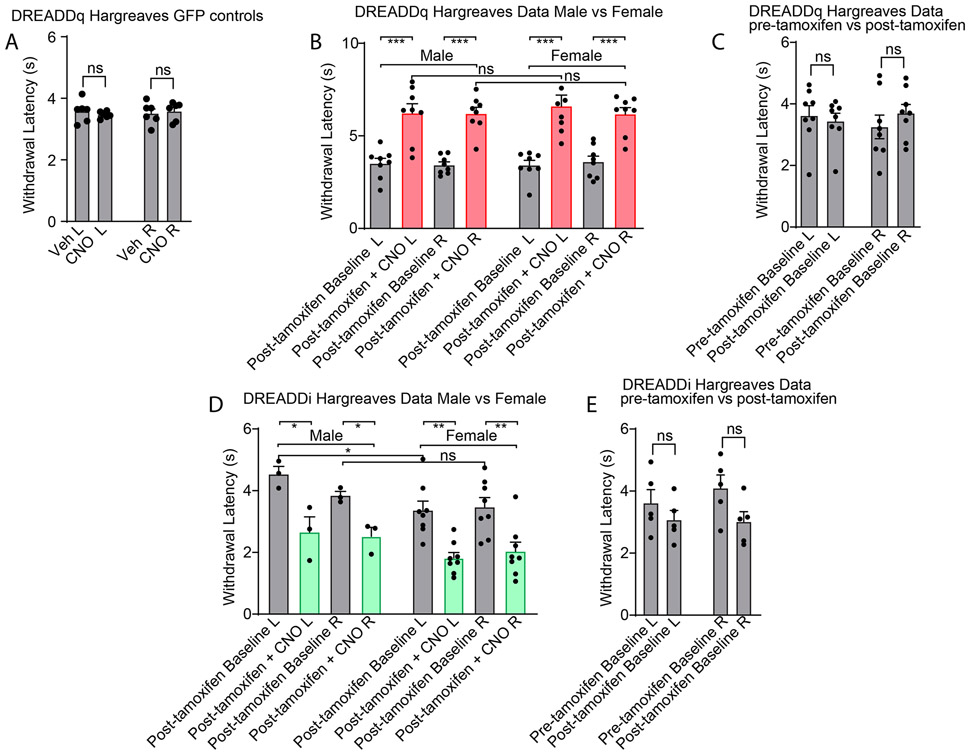
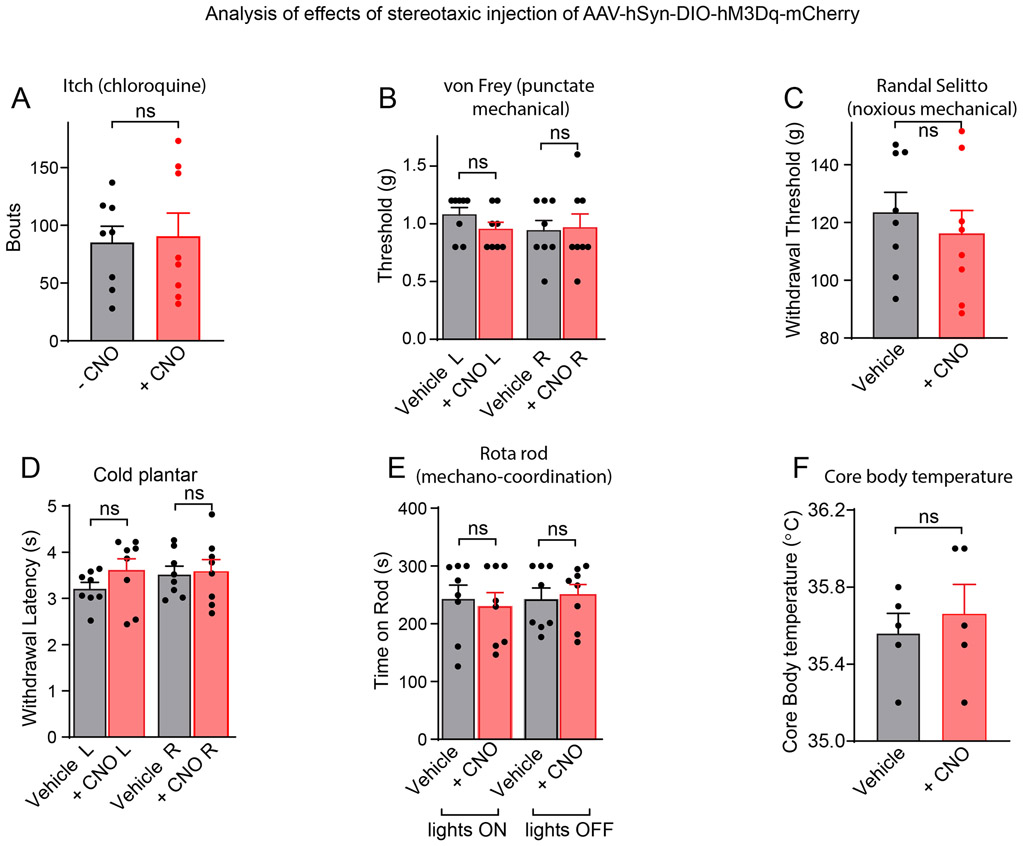
Our photometry experiments uncovered that cVLMTH neurons are sensors of noxious insults, suggesting that the cVLM might be involved in a pain pathway. To investigate how they might participate in pain signaling, we took advantage of the fact that we could target expression of specific genes to these neurons using viral approaches. Specifically, we examined the behavioral consequences of unilateral stimulation of VLMTH neurons in TH-CreERT2 mice with designer receptors exclusively activated by designer drugs (DREADD) which were expressed selectively and efficiently in these neurons (Figure 3 A-D). This chemogenetic strategy to examine the cellular function should result in increased cfos staining in cVLMTH neurons. Figure 3EF shows that, as expected, upon activation with CNO, there was a marked increase in numbers of cfos positive TH-neurons. We anticipated that if cVLMTH neurons are part of a nociceptive pathway, then their activation might elicit changes in withdrawal from painful stimuli. Indeed, activation of cVLMTH neurons evoked a profound suppression of responses to heat in Hargreaves tests (Figure 3G and see Extended Data Figure 3A-C for controls), suggesting that cVLMTH cells may be part of a nociceptive modulatory system. Unexpectedly, although we performed unilateral cVLM-stimulation, decreased sensitivity was induced in both ipsilateral and contralateral hind paws (diffuse inhibition) with both the right and left cVLM producing similar diffuse inhibition (Figure 3H). In addition, further suggesting a role for these neurons in pain control, chemogenetic activation of cVLMTH neurons increased the latency for lick responses on a hot-plate assay, a behavior that requires supraspinal processing of nociceptive signals (Figure 3I). By contrast, chemogenetic activation of cVLMTH-neurons had no detectable effects on behavioral responses to itch, cooling, and mechanical stimulation (including pinch) and additionally did not change core-body temperature and motor coordination (Extended Data Figure 4A-F).
Figure 3. VLMTH neurons potently control nociceptive behavioral responses.
A. Strategy employed to chemogenetically stimulate cVLMTH neurons. B. Representative image showing the neurons expressing DREADDq-mCherry in the cVLM, scale bar 500 μm. C. Magnified view (boxed area in B) displaying that mCherry expressing neurons are all TH-positive. D. Quantification of the numbers of TH-neurons expressing mCherry, n=7 mice data are presented as mean ± SEM (mCherry+TH+/TH+=177/281). E. Upon addition of CNO (lower panels), DREADDq stimulation led to cfos expression in TH+-immunostained neurons, scale bar 50 μm. F. Quantification of the percentage of TH-neurons expressing cfos, n = 3 mice for each group, p=0.0003, two-sided unpaired t-test, data are presented as mean ± SEM (Veh, cfos+mCherry/mCherry+=21/75, CNO, cfos+mCherry/mCherry+= 83/83). G. Withdrawal latencies were significantly increased, in Hargreaves tests, for mice where CNO was used to stimulate DREADDq in cVLMTH neurons compared to saline injected mice (L and R indicate left and right hind-paw respectively), n=16 mice, p<0.0001 for left (L) and p<0.0001 for right (R) hind-paws two-sided paired t-test, data are presented as mean ± SEM. H. Behavior data for chemogenetic activation of cVLMTH neurons (CNO administration) comparing left versus right cVLM injection. There were no significant differences in behavior between left and right injected animals, n = 8 mice for each group, F=0.3848, p= 0.765, one way ANOVA, data are presented as mean ± SEM. I. On hot-plate test (52oC), the latency to lick was significantly increased in response to chemogenetic stimulation of cVLMTH neurons compared to saline controls, n=8 mice, p=0.024, two-sided paired t-test, data are presented as mean ± SEM. J. Schematic of the strategy employed to chemogenetically inhibit cVLMTH neurons. K. Chemogenetic inhibition with DREADDi caused a significant shortening of withdrawal latencies compared to saline controls, n=11 mice, p<0.0001 for L and p=0.0002 for R hind-paws, two-sided paired t-test, data are presented as mean ± SEM. L. Diphtheria toxin subunit A was expressed, after tamoxifen induction, in cVLM TH-neurons of TH-CreER mice. Ablation of cVLMTH neurons caused a significant shortening of withdrawal latencies compared to saline controls, n=11 mice, p<0.0001 for L and, p=0.0002 for R hind-paws, two-sided paired t-test, data are presented as mean ± SEM.
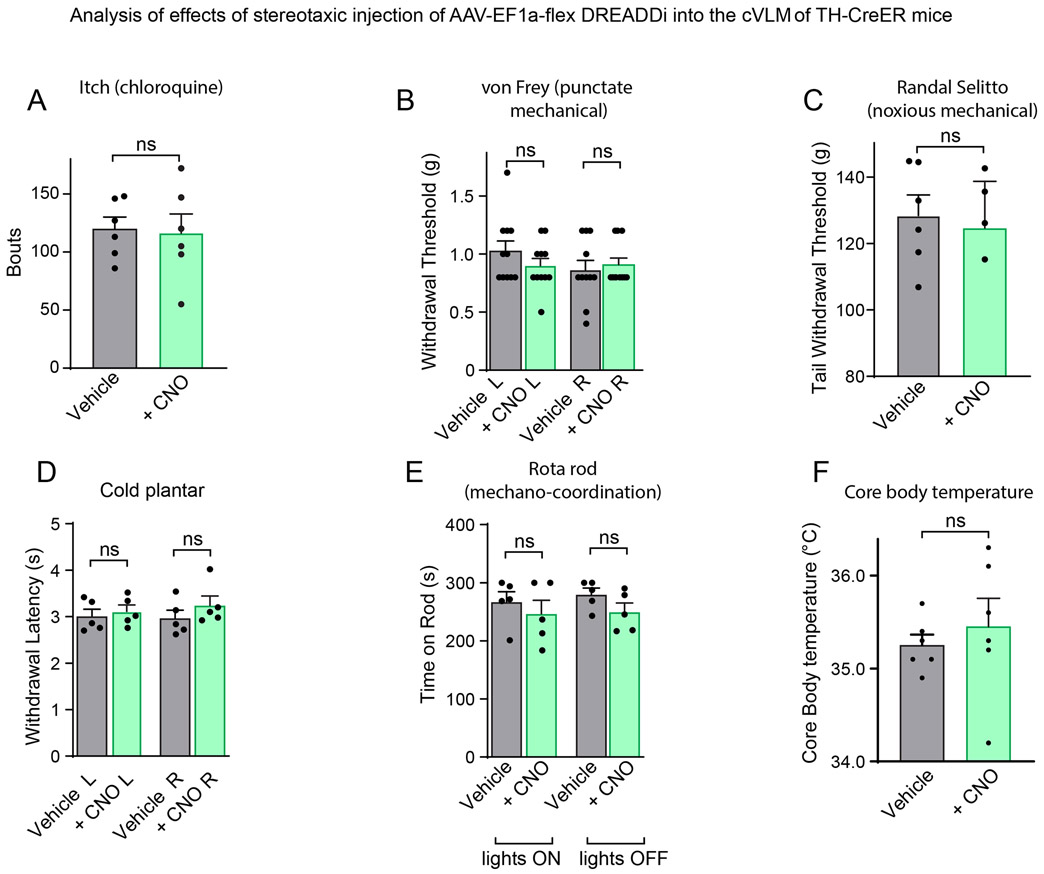
A corollary of chemogenetic activation of cVLMTH neurons triggering decreased sensitivity to heat is that their inhibition, if they are tonically active in basal conditions, might elicit increased sensitivity. Indeed, DREADDi manipulation (Figure 3J) reduced diffusely the latency of withdrawal responses in Hargreaves assays suggesting that they normally provide inhibitory tone in naïve conditions (Figure 3K and see Extended Data Figure 3DE for controls). Selective ablation of cVLMTH neurons, produced increased sensitivity to heat challenge (Figure 3L). Similar to chemogenetic activation, altered responses to heat stimuli was the only sensory modality where we detected changed responses to chemogenetic inhibition (Extended Data Figure 5A-F).
While chemogenetics is a powerful technique to probe the function of neuronal ensembles, it offers low temporal precision. Therefore, we employed optogenetics to examine the time course of cVLM induced changes in behavioral responses and the time required, after cessation of stimulation, for deactivation (Figure 4A). Similar to chemogenetic stimulation, while expression of control mCherry had no effects, optogenetic activation was effective at reducing sensitivity to noxious heat (Figure 4C-D, see panel B for controls). Interestingly, minutes after optogenetic stimulation had ended, there was residual suppression of responses to noxious heat showing that cVLMTH neurons activate a slowly desensitizing inhibitory circuit (Figure 4D). Together these results establish that, in an apparent feed-forward inhibitory circuit, noxious stimuli activate cVLMTH neurons which in turn participate in antinociception.
Figure 4. Optogenetic stimulation of cVLMTH triggers extended suppression of nociceptive responses.
A. Strategy used to stimulate cVLMTH neurons and representative image of ChR2 expression in the cVLM. B. In control experiments where AAV2-DIO -GFP virus was injected into cVLM of TH-Cre mice, optogenetic stimulation of the LC did not alter responses in Hargreaves behavioral tests, n=7 mice, p=0.85 for L and p=0.91 for R hind-paws, two-sided paired t-test, data are presented as mean ± SEM. C. Optogenetic stimulation caused a significant increase in withdrawal latencies in Hargreaves assays, compared to baseline, n=7 mice, p=0.014 for L and p=0.0059 for R hind-paws, two-sided paired t-test, data are presented as mean ± SEM. D. Time-course for activation and deactivation of attenuated responses to heat challenge (Hargreaves test) following optogenetic stimulation; testing was performed prior to, during (blue line), and after optogenetic stimulation. There was a significant difference in withdrawal responses compared to baseline during stimulation and at 2 min after the end of optogenetic stimulation, p=0.025 and p=0.021 respectively, n=7 mice, Dunnett’s tests following One-Way ANOVA.
cVLMTH neurons are connected to a descending LC–SC pathway
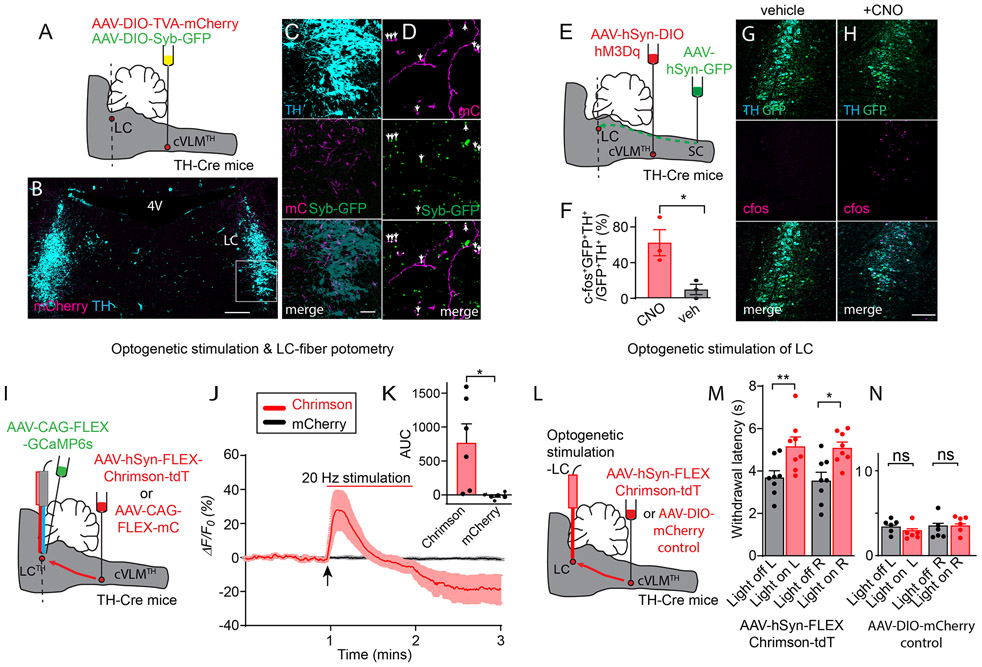
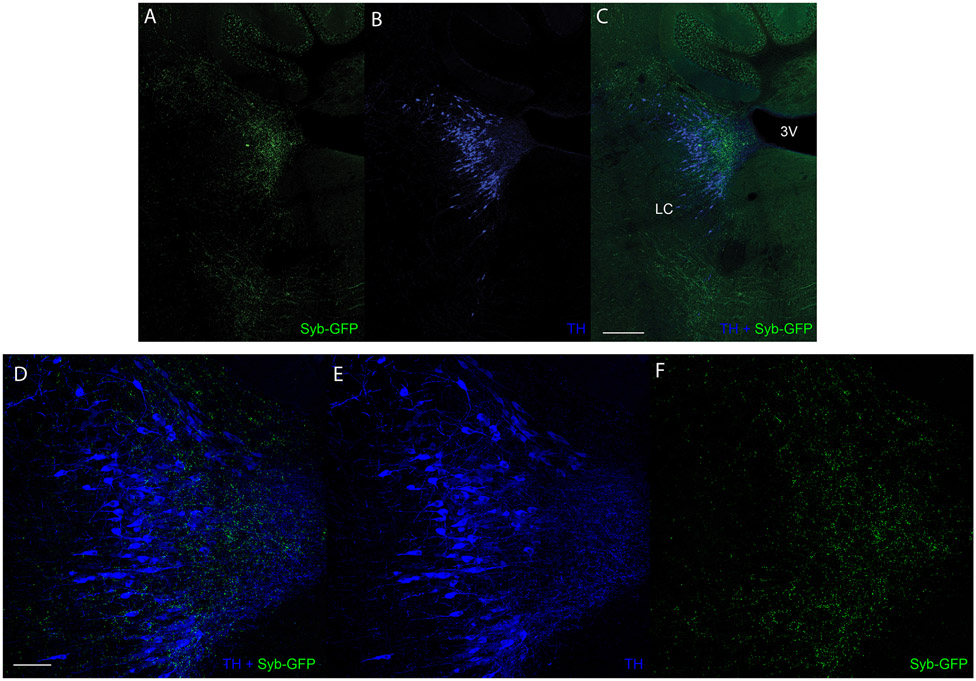
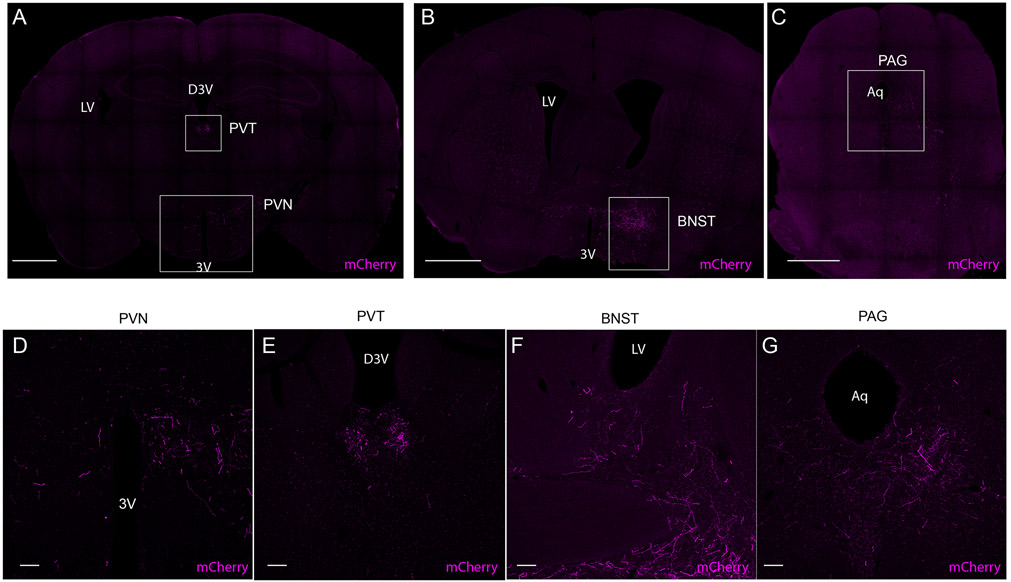
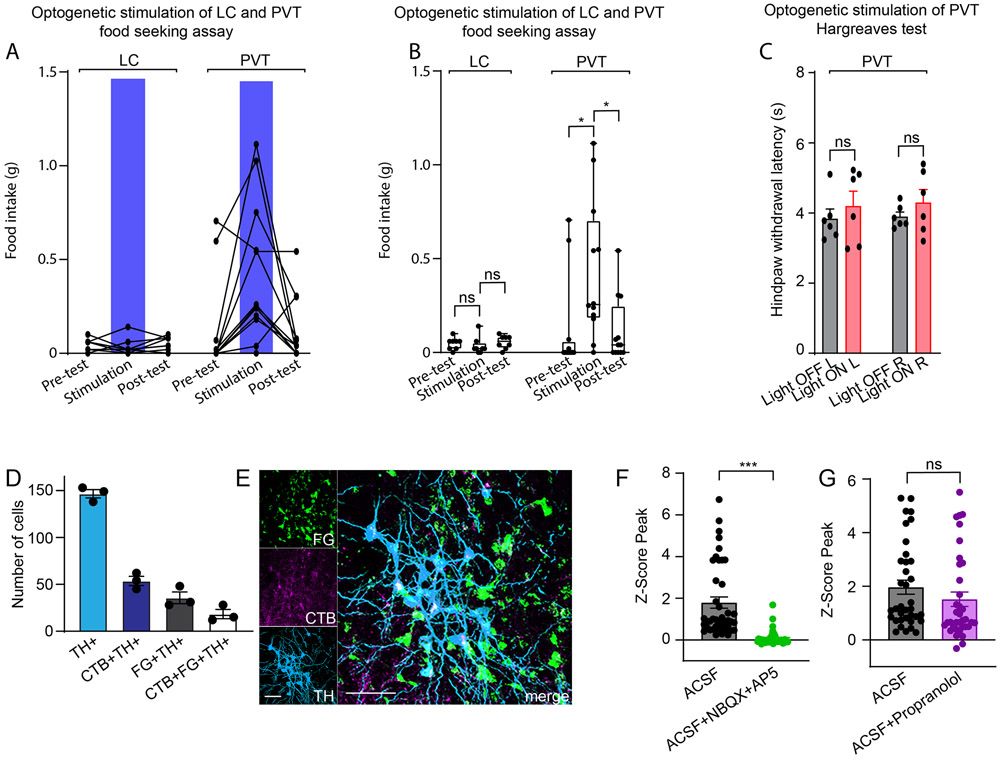
To understand more about the potential mechanisms by which the cVLMTH ensemble might induce antinociception we investigated the downstream targets of these cells. We identified their projection targets by injecting Cre-dependent AAVs expressing mCherry and synaptobrevin-GFP into the cVLM of TH-Cre mice to mark nerve fibers and the synapses of cVLMTH neurons respectively (Figure 5A). This approach revealed termination of axons in a number of brain nuclei. Of particular interest, we found strong labeling of VLMTH-neurons terminals in the LC (Figure 5B-D and Extended Data Figure 6A-F). Additionally, as reported previously, we uncovered projections to the periaqueductal grey (PAG), the paraventricular hypothalamus (PVN), the paraventricular thalamus (PVT), and the bed nucleus of the stria terminalis (BNST)30,31(Extended Data Figure 7A-G). The LC is a brain-nucleus well-known to mediate analgesia through descending SC projections15,32,33, suggesting that it could be a downstream partner that might be responsible for the antinociceptive effects of the cVLM. To determine whether the LC is functionally engaged by the cVLM, we used a number of complementary experimental approaches. First, using cfos-expression as a metric for cell-activation, we investigated whether activation of cVLMTH neurons is sufficient to activate LC-neurons (Figure 5E). For these experiments, we chemogenetically activated cVLMTH neurons in conjunction with labeling LC-SC projecting neurons (by intra-spinal injection of GFP-expressing AAV in the SC) and determined numbers of spinally projecting LC-neurons positive for cfos. Using this approach, we observed robust activation of LC-SC neurons consistent with activation of LC-neurons by the cVLM (Figure 5F-H). Second, we assessed whether calcium responses in LC-neurons can be evoked by the activation of the cVLMTH ensemble. We combined optogenetic stimulation of cVLM nerve terminals in the LC with calcium imaging of LC-cells (Figure 5I). Results from these experiments establish that the activation of LC-neurons is tightly connected with stimulation of cVLMTH neurons (Figure 5JK). Thirdly, we examined whether activation of terminals of cVLMTH neurons projecting to the LC can modulate nociceptive responses (Figure 5L). We injected AAV-hSyn-FLEX-Chrimson into the cVLM of TH-Cre mice and optogenetically stimulated cVLMTH -nerve terminals in the LC. Figure 5M shows that the activation of cVLMTH fibers increased withdrawal latencies corroborating that the LC is an important route for cVLM mediated inhibition of heat responses. We previously showed that activation of cVLM-nerve fibers in the PVT induces increased food seeking behavior34 and we wondered whether activation of LC-terminals would have a similar effect. Suggesting specificity, the optogenetic stimulation of the LC did not change feeding responses (Extended Data Figure 8AB). In addition, activation of PVT-terminals did not alter sensitivity to heat in Hargreaves tests (Extended Data Figure 8C) indicating distinct responses are driven by different cVLM outputs.
Figure 5. A descending antinociceptive cVLM-LC-spinal cord circuit.
A. Scheme of injections. B. Representative image of a section of the hindbrain (approx. position shown by dotted line A.) showing TH-stained cells (cyan), labeled fibers (magenta) and synaptic boutons (green) of cVLMTH neurons. C. Magnified view of boxed area in B. D further magnified view showing individual fibers and location of syb-GFP. E. Strategy for chemogenetic stimulation of cVLMTH-neurons and for labeling of SC-projecting LC neurons. F. Quantification of numbers of LC neurons projecting to the SC (GFP+TH+) which were cfos positive (cfos+GFP+TH+) revealed a significant alteration in numbers upon stimulation compared to saline control, n=3 mice, p=0.029, two-sided paired t-test, data are presented as mean ± SEM (CNO, cfos+GFP+TH+/GFP+TH+ = 32/65, Veh, cfos+GFP+TH+/GFP+TH+=3/30). G-H. Representative images of LC sections (approx. position shown by dotted line in panel E) for mice administered vehicle (G) or CNO (H). I. Approach used to optogenetically activate LC-projecting cVLMTH neuronal fibers in conjunction with record calcium responses in LC-neurons. J. Measurement of calcium responses in LC-neurons using in vivo fiber photometry showed that stimulation of LC projecting cVLMTH neuronal fibers rapidly increase intracellular calcium in LC neurons, data are presented as mean results (red or black line) ± SEM (pink or grey). K. Quantification of area under the curve (AUC) responses show that activation of Chrimson expressing fibers produces significantly different responses compared to mCherry-expressing fibers, n=6 mice, p=0.017, two-sided paired t-test, data are presented as mean ± SEM. L. Approach used to optogenetically activate LC-projecting cVLMTH neuronal fibers. M. Optogenetic stimulation of Chrimson in LC terminals caused a significant increase in withdrawal latencies in left (L) and right (R) hind-paws, in Hargreaves assays, compared to baseline, n = 8 mice, p=0.0097 for L and p=0.0196 for R hind-paws, two-sided paired t-test, data are presented as mean ± SEM. N. Optogenetic stimulation of LC terminals expressing mCherry did cause a significant increase in withdrawal latency, n=6 mice, p=0.090 for L and p=0.94 for R hind-paws, two-sided paired t-test, data are presented as mean ± SEM. Scale bars: 500 μm in B; 50 μm in C; 100 μm in G and H.
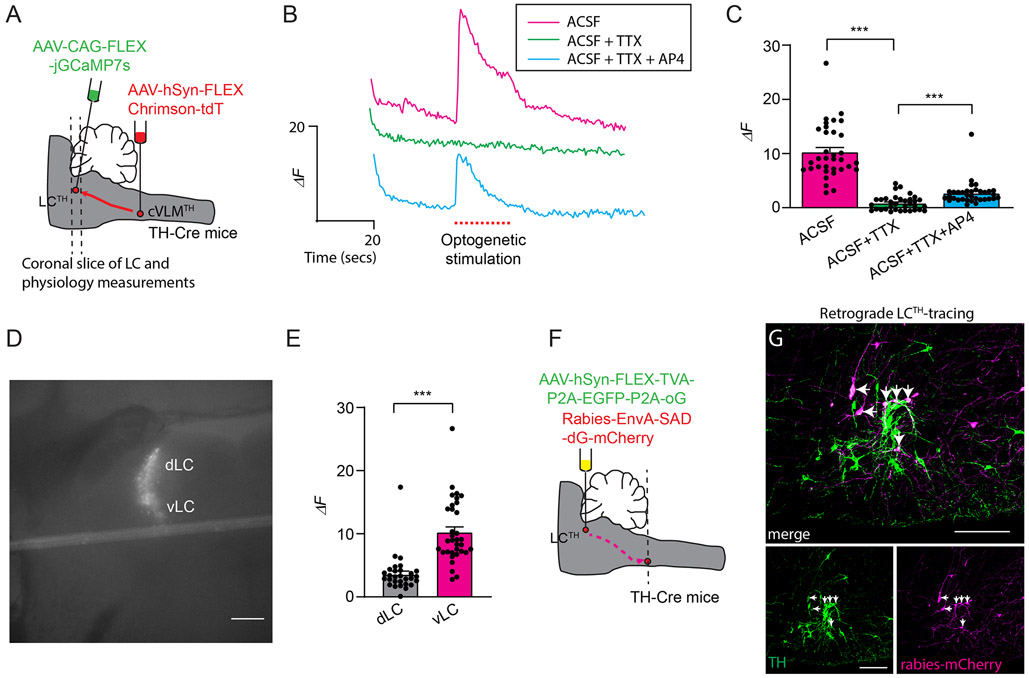
These data strongly suggest that cVLMTH neurons activate the LC, however, they do not establish that neurons in these nuclei are synaptically connected. To investigate the coupling of cVLMTH neurons with the LC, we performed physiology experiments on coronal LC slices from mice expressing the light sensitive channel Chrimson in cVLMTH neuronal terminals and GCaMP7s in LCTH neurons (Figure 6A). This approach limits the input to LCTH neurons to only cVLMTH neurons expressing Chrimson. Activation of VLMTH neurons terminals in the LC-slice should stimulate LCTH neurons if they are synaptically connected. Confirming input to the LC comes from cVLMTH neurons, optogenetic stimulation led to increased calcium in LCTH neurons (Figure 6BC). These responses were blocked by TTX toxin application, an effect that could be partially reversed by co-application of 4-AP35. These findings support the existence of connectivity between cVLMTH and LCTH neurons. The connections between the cVLM and LC are likely complex and may contain both monosynaptic and polysynaptic connections. Consistent with the fact that spinally projecting LCTH neurons are mostly found in the ventral LC15,36, ventrally located cell-bodies were preferentially activated by optogenetic stimulation (Figure 6E). Additionally, we examined whether Calcium responses were affected by application of either β-adrenergic or glutamate receptor antagonists. Interestingly, responses were attenuated by NBQX plus AP5, but not by propranolol (Extended Data Figure 8FG), suggesting that glutamate is the major transmitter at this particular synapse. Since the early phase of the response is driven by glutamate (as confirmed by NBQX and AP5) the transient response seen in Figure 6B is not surprising. The result suggest that this synapse can’t sustain prolonged activation likely due to neurotransmitter/vesicle depletion which is observed in high probability synapses when stimulated at high frequency (also see results in Figure 5J). In order to provide further evidence for synaptic connection between cVLMTH and LCTH neurons, we performed retrograde rabies virus tracing studies (Figure 6FG). For these tracing studies, we injected the LC of TH-cre mice with Cre-dependent AAVs that express G-protein and TVA and then injected EnvA pseudotyped rabies virus (G-protein deleted; monosynaptic) into the LC37, Figure 6F. As expected, this approach revealed a monosynaptic connection from LCTH neurons to cVLMTH neurons (Figure 6G). Examination of the collaterals between the cVLM and the LC and the PVT revealed evidence for extensive collaterals of cVLM axons to these two nuclei, Extended Data Figure 8DE. Therefore, the results from the optogenetic experiments do not exclude the possibility that another (non-PVT) collateral may mediate the effect but combined with the data in Figures 6 and 7 (as well as Extended Data Figure 8A-C), the findings strongly suggest that the pathway exploited for these responses occurs via the LC.
Figure 6. cVLMTH neurons form monosynaptic inputs in the LC.
A. Strategy used to express light activated ion-channel, Chrimson, in cVLMTH terminals and express GCamp6s in LCTH-neurons. B. Representative fluorescence traces of an individual LCTH-neuron expressing jGCaMP7s showing that intracellular calcium is increased by optogenetic stimulation (red dots) in the presence of ACSF (magenta), but responses are reduced by application of TTX (green, 1 μM), and responses are partially recovered by application of 4-AP (blue, 100 μM). C. Summary data of the average intensity peak of jGCaMP7s fluorescence relative to baseline fluorescence from cells in the vLC. TTX treatment compared to ACSF alone and TTX versus TTX + 4-AP treatment significantly affected peak responses, n = 34 cells from 3 mice, p<0.0001 and p<0.0001 respectively, two-sided unpaired t-test, data represent means ± SEM. D. Representative image of an LC slice showing location of jGCaMP7s expression, scale bar 50 μm. E. Quantification of the averaged intensity peaks of GCaMP6s fluorescence relative to baseline fluorescence for cells located in the ventral or dorsal LC (vLC and dLC). Responses in vLC compared to dLC are significantly different, n=34 vLC-cells and n=30 dLC-cells from 3 mice, p<0.0001, two-sided unpaired t-test, data represent means ± SEM. F. Schematic of the approach used to examine retrograde monosynaptic connection between LCTH-neurons and cVLMTH neurons. G. Representative image of a section through the medulla showing transfer of mCherry rabies (magenta) from the LC to cVLMTH neurons (green, anti-TH stained), n=3 mice, scale bar 50 μm. Arrows indicate neurons double strained for mCherry and TH.
Figure 7. Antinociceptive and pronociceptive responses induced by cVLMTH neurons are mediated via noradrenergic mediated processes.
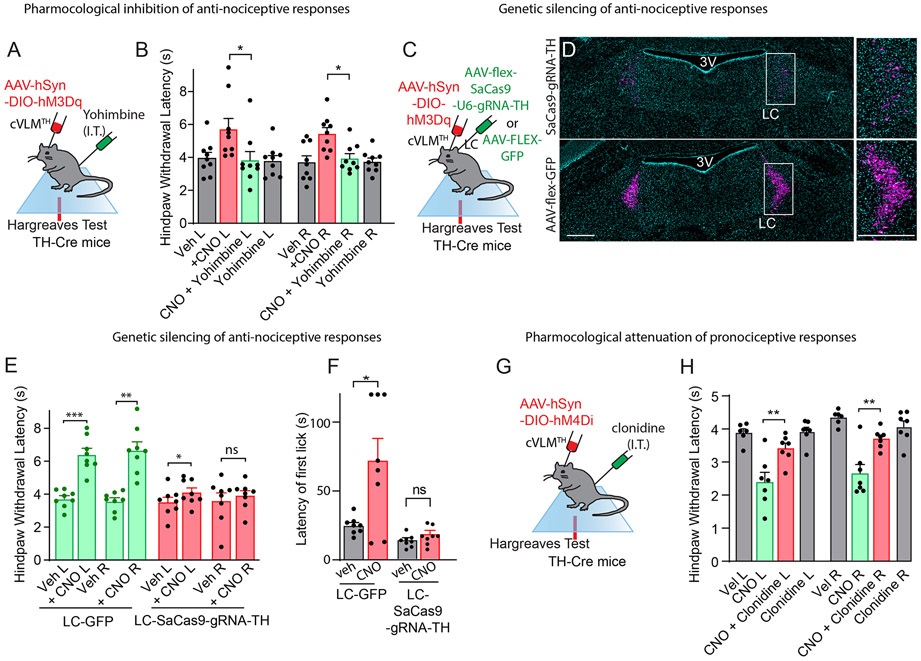
A. Experimental approach to examine effects of NA on cVLMTH neuron induced antinociceptive effects. B. Chemogenetic activation of cVLMTH neuron induces increased withdrawal latencies in Hargreaves test which were significantly attenuated by intrathecal administration of yohimbine, n=9 mice, p=0.05 for L and p=0.018 for R hind-paws respectively, two-sided paired t-test, data represent means ± SEM. C. Approach used to measure the contribution of LC NA on cVLM-induced antinociception; AAV-mediated CRISPR was employed to disrupt TH-expression in the LC. D. Representative image of a coronal pons section showing staining for TH (magenta and DAPI-cyan) in mice treated with indicated viruses, similar results were observed in n=3 mice, scale bars 500 μm. Boxed areas indicate magnified images in panels to the right. Quantification of neurons revealed 83 ± 2.6% of TH-neurons were lost following CRISPR treatment (1362 TH+-neurons in control versus 224 neurons). E. There was significant change (left side only) in chemogenic induced nociception responses in Hargreaves tests of TH-cre mice injected with AAV9-CMV-FLEX-SaCas9-U6-sgRNA-TH bilaterally into the LC, n=8 mice, p=0.047 and p=0.54 for L and R hind-paws respectively, two-sided paired t-test, data are presented as mean ± SEM. GFP control animals (injection of AAV-LEX-GFP into LC) showed significant changes in responses, n = 8, p=0.0002 and p=0.0015, for L and R hind-paws respectively, two-sided paired t-test, data represent means ± SEM. F. On hot-plate test (52oC), the latency to first lick was significantly changed in control mice (LC-GFP) upon chemogenetic stimulation (CNO) of cVLMTH neurons, n=8 mice, p=0.024, data are presented as mean ± SEM. Mice injected with AAV9-CMV-FLEX-SaCas9-U6-sgRNA-TH bilaterally into the LC exhibited no change in latency upon chemogenetic activation of cVLMTH neurons, n=8 mice, p=0.19, two-sided paired t-test, data are presented as mean ± SEM. G. Experimental approach to assay modulation of behavior elicited by chemogenetic inhibition (DREADDi) of cVLMTH neurons. H. Intrathecal injection of the α2-adrenergic agonist, clonidine, reversed the CNO-induced sensitization of hind-paw responses measured with the Hargreaves tests, n = 7, p =0.0018 and p=0.0067, for L and R hind-paws respectively, two-sided paired t-test, data are presented as mean ± SEM.
cVLMTH neuron-induced antinociception occurs in the SC
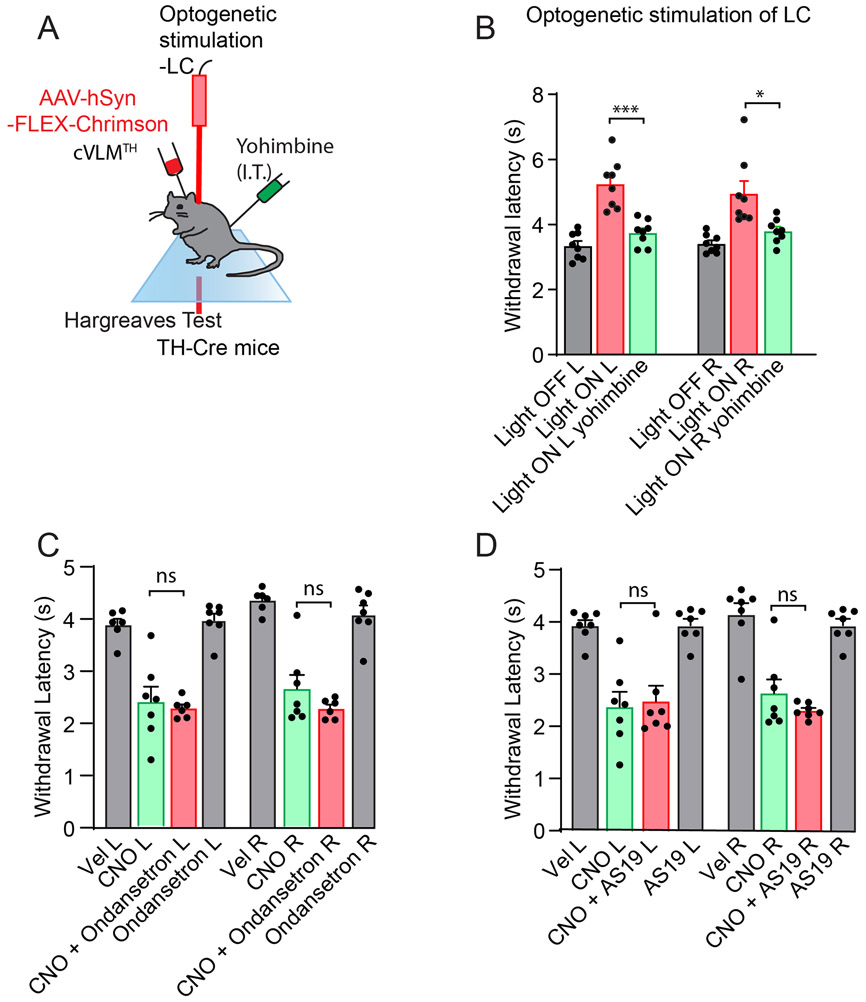
Our results suggest that the cVLM is part of a LC to SC pathway. Since a major neurotransmitter of LC-neurons is NA and NA agonists are known to induce analgesia in the spinal cord32, we wondered whether cVLM induced antinociception might be attenuated by local spinal cord delivery of α2-adrenergic receptor antagonist. To test this postulate, we chemogenetically activated cVLMTH neurons and examined whether the injection of the α2-adrenergic receptor antagonist yohimbine could block the cVLMTH chemogenetic-induced reduction in heat sensitivity (Figure 7A). As anticipated for a descending spinal cord noradrenergic pathway32, this treatment blocked cVLM chemogenetic-induced antinociception (Figure 7B) suggesting that a major descending pathway of the cVLM is via the SC neurotransmitter NA. In addition, as expected, we found that cVLM optogenetic induced antinociception was almost completely inhibited by yohimbine treatment (Extended Data Figure 9AB). We decided to probe this postulate further and used an AAV-mediated CRISPR38 genetic strategy to eliminate noradrenalin synthesis specifically in the LCTH neurons. We selectively expressed SaCas9 in LC-neurons as well as a guide RNA which targets the specific disruption of TH gene (Figure 7C)38. This manipulation resulted in more than 80% reduction in cells expressing TH (Figure 7D). As predicted for NA being the major transmitter in spinal cord in the cVLM-LC-SC circuit, loss of TH-expression in LC-neurons has a major effect on cVLM dependent reduced sensitivity to heat (Figure 7E). Furthermore, latency to lick responses in a hot plate assay was similarly attenuated by CRISPR mediated gene disruption (Figure 7F). Cumulatively, these studies establish that the LC and LC-derived NA are required for cVLMTH dependent antinociception.
Given that NA is required for cVLM induced antinociception, then cVLMTH induced pronociception might be expected to be reduced by administration of an adrenergic receptor agonist (Figure 7G). As predicted, clonidine (an α2- adrenergic receptor agonist) treatment almost completely alleviated chemogenetic (DREADDi) mediated sensitization to heat (Figure 7H). In contrast, pharmacological interventions of serotonin signaling39,40 were ineffective at relieving cVLM induced pronocicieption (Extended Data Figure 9CD). Together, these results demonstrate that the LC is both required and sufficient for cVLM mediated control of heat antinociceptive responses providing confirmation of the cVLM-LC-SC circuit.
The cVLM is required for counter-stimulus induced analgesia.
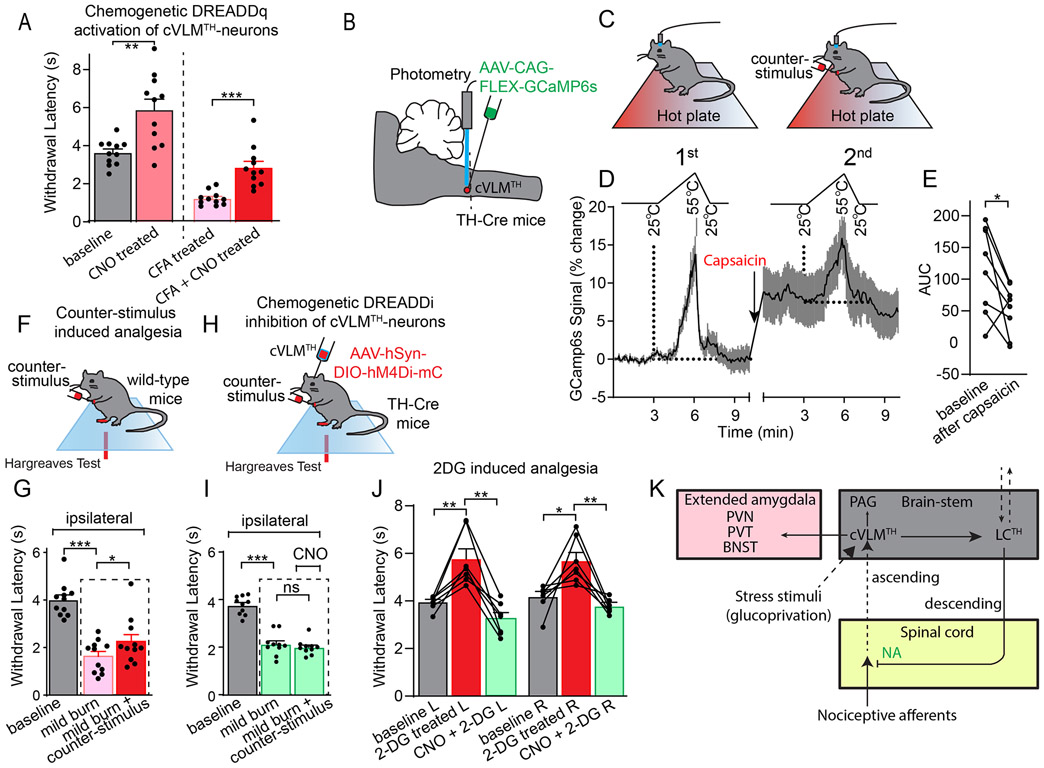
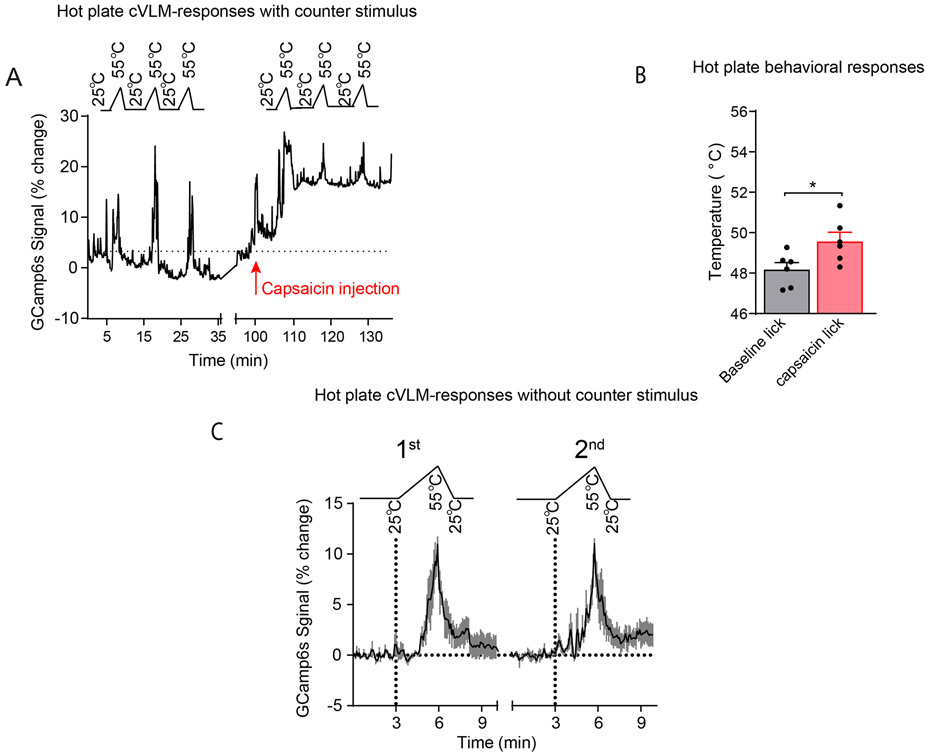
Results from our chemogenetic and optogenetic studies showed that the cVLM-LC-SC circuit can elicit a diffuse reduction in responses to heat. The characteristics of this circuit show some similarity to those reported for a number of descending pain pathways 1,2,41-44. Some of these pathways have been shown to utilize NA and are reported to be controlled by supraspinal nuclei in the brainstem. State-dependent pain control, including counter-stimulus induced analgesia, have been proposed to be potential physiological roles for some of these circuits. Therefore, we sought ways to test whether the cVLM can induce analgesia. We probed whether the activation of the cVLM-circuit is sufficient to alleviate thermal allodynia (a pain state). We injected CFA into a hind-paw of mice to produce inflammatory pain and tested whether chemogenetic activation of cVLMTH neurons could reverse the resulting increased thermal sensitivity. Withdrawal latencies of the injured foot, after cVLMTH activation, were returned almost to baseline, demonstrating that cVLMTH neurons are sufficient to reverse thermal allodynia (Figure 8A). These results agree with our finding that chemogenetic activation of the cVLM is sufficient to attenuate reactions to heat in hot-plate tests (Figure 3I and 7F). To try to understand more about potential roles for the cVLM we next examined whether it might be involved in counter stimulus induced analgesia. Specifically, we examined whether calcium responses in cVLMTH neurons to noxious challenge are altered by a counter-stimulus and would act in a feed-forward circuit to inhibit input to itself. In these studies, we compared responses of cVLMTH neurons to a series of heat stimuli (three 55 °C ramps) before and after administration of a painful counter-stimulus (injection of 10 μg capsaicin into a forepaw) (Figure 8BC). As expected, this counter-stimulus evoked delayed licking behavior to noxious heat (Extended Data Figure 10B). In addition, as we previously observed, capsaicin treatment evoked a large increase in baseline calcium (Figure 2B). This counter-stimulus, after subtraction of baseline, also resulted in significantly smaller calcium responses to heat challenge than those seen in naïve conditions (Figure 8DE and Extended Data Figure 10A). Control studies using mice tested, without counter-stimulus, to the same series of noxious heat stimuli did not show differences in responses between series of tests (Extended Data Figure 10C). We next examined whether cVLMTH neurons are required for counter-stimulus induced analgesia by developing a mouse model. In this model, reactivity to heat was assessed in an injured paw (mild-burn) and then a counter stimulus delivered (capsaicin injection into a forepaw) and the assay repeated comparing the withdrawal responses before and after counter-stimulus (Figure 8F). Using this model, we found that a counter-stimulus can produce analgesia in the injured hind-paw (Figure 8G). Next, we tested whether chemogenetic inhibition of cVLMTH neurons attenuate counter-stimulus induced analgesia. In these experiments we used mice where we chemogenetically inhibited cVLMTH neurons (Figure 8H). Demonstrating that the cVLM is required for counter-stimulus induced analgesia, when the cVLMTH neurons are inhibited, counter-stimulus induced analgesia was eliminated (Figure 8I). Together our results demonstrate that the cVLM circuit is required for counter-stimulus induced analgesia and is sufficient to induce analgesia.
Figure 8. The cVLM-circuit is required and sufficient for counter-stimulus induced analgesia.
A Chemogenetic activation of cVLMTH neurons significantly lengthens withdrawal latencies to heat stimulation after inflammation (complete Freuds Adjuvant (CFA)), n=11 mice, p=0.0038 for baseline vs CNO treated and p=0.0005 for CFA treated vs CFA+CNO treated, two-sided unpaired t-test, data are presented as mean ± SEM. BC. Approach used to record changes in intracellular calcium in cVLMTH-neurons and design for counter-stimulus experiments. D. Averaged responses over trials before and after counter-stimulation showed that responses to individual ramps, after subtraction of baselines, were diminished after capsaicin treatment, data are represented as mean results (black line) ± SEM (grey). E. Quantification of AUC for responses to heat ramps were significantly reduced after capsaicin treatment, n=8 mice, p=0.033 two-sided paired t-test. F. Experimental design for measurement of counter-stimulus induced analgesia; one hind-paw received a mild-burn (ipsilateral) and withdrawal latencies were determined using the Hargreaves test before and after capsaicin injection into a forepaw. G. Latencies for withdrawal of the ipsilateral paw were significantly reduced compared to baseline after mild burn and were significantly increased compared to mild-burn after administration of counter stimulus, n=11 mice, p<0.001 and p=0.035 respectively, two-sided paired t-test, data are means ± SEM. H. Approach used to determine the effect of cVLMTH-circuit on counter-stimulus induced analgesia. I. Chemogenetic inhibition of cVLMTH neurons prevented attenuation of counter-stimulation (capsaicin) induced analgesia of the ipsilateral paw, n=10 mice, p=0.36, two-sided paired t-test, data are presented as mean ± SEM. J. Hargreaves withdrawal responses were significant longer after 2DG treatment compared to baseline, p=0.0047 and p=0.023 for L and R hind-paws respectively, and 2DG responses were significantly reduced compared to chemogenetic inhibition (CNO), p=0.0013 and p=0.003 for L and R hind-paws respectively, n=7 mice, two-sided paired t-test, data are presented as mean ± SEM. K. Proposed model for feed-forward inhibition by the cVLM-circuit. Dotted lines indicate proposed pathways.
We recently investigated the contribution of output from cVLMTH neurons to the PVT in food-seeking behaviors34. These studies demonstrated that the cVLM is activated during extreme glucose privation (glucoprivation). In addition to being involved in homeostatic feeding responses to glucoprivation, it has been reported that glucoprivation itself induces analgesia5. Therefore, we wondered whether the cVLM might also be involved in this type of analgesic response. To test this proposal, we induced glucoprivation in mice by administering 2-deoxy-D-glucose (2DG) and examined whether the resulting antinociceptive responses are attenuated by chemogenetic inhibition of cVLMTH neurons. Indeed, inhibition of VLMTH neurons prevented 2DG induced antinociception (Figure 8JK) consistent with the participation of the cVLM-LC-SC circuit in glucoprivation dependent analgesia. However, this does not rule out non-LC-SC circuit being involved.
Discussion
Here we investigated a brain region previously shown to regulate pain, and uncovered molecular details and mechanisms for a cVLM–LC–SC pathway2,9. We identified a small group of noradrenergic neurons in the cVLM that are robustly stimulated by noxious stimuli. When activated, these neurons trigger marked antinociception to heat without affecting behavioral responses to all other sensory modalities tested. Animals in which cVLMTH neurons were inhibited or ablated exhibited increased sensitivity to heat, suggesting that these neurons provide tonic inhibition in naïve conditions. Our work further revealed that cVLMTH neurons send projections to the LC, that activation of cVLMTH neurons induces cfos labeling of LCTH neurons, and that activation of cVLMTH terminals in the LC increases intracellular calcium in LCTH neurons. Importantly, functional coupling between the cVLM and LC occurred specifically in ventral LCTH neurons, consistent with the known distribution of SC-projecting neurons in the LC15,36. In line with this, we demonstrated that cVLM mediated antinociception is dependent on noradrenergic signaling in the spinal cord. Lastly, we found that activation of cVLMTH neurons can ameliorate heat allodynia, and that inhibition of cVLMTH neurons reduced counter-stimulus induced analgesia. Overall, our studies identify a pain-regulating circuit, expanding our understanding of inputs to the LC descending pain pathway.
More than 35 years ago, it was first shown that electrical stimulation of the medulla could elicit reduced responses to heat20. Subsequent studies reported that glutamate and GABA agonist injected into a similar region produced the same effects21,22. Although the exact neurons affected by these manipulations remain unclear, our results provide a possible explanation for these findings. As cVLMTH neurons are predominantly excitatory, glutamate injection and electrostimulation might directly activate them to trigger antinociception through the pathways we describe. It is not immediately apparent how the neurons we characterized might be affected by GABA-agonist injection, but possible explanations could be that there are cVLMTH neuron-independent pathways or that inhibitory neurons modulate cVLMTH neuronal activity through disinhibition. Previous studies found connections from cVLM to SC and from cVLM to A5 nucleus; however, we did not find evidence that cVLMTH neurons target these areas13,24, suggesting there may be additional cVLM neurons involved in pain regulation. We attempted to map the afferent inflow to cVLMTH neurons, since noxious signals are initially detected by sensory neurons and signals from these neurons are transmitted through SC circuits to the brain. Although we observed cells adjacent to cVLMTH neurons that are post-synaptic to spinal cord projection neurons, we do not know whether these cells activate cVLMTH neurons. Future studies will be required to determine whether these or other inputs transmit signals from noxious insults to cVLMTH neurons. In addition, as well as pain inputs affecting cVLMTH neurons, we showed that glucoprivation evoked antinociception and requires cVLMTH neurons. This indicates that cVLMTH neurons receive input from non-SC sources in addition to indirect input from SC projection neurons, raising the interesting possibility of a function for the cVLM as a center for convergence of different stressful stimuli that effect nociception.
We previously described that the cVLMTH neurons send projections to the PVT and demonstrated that this connection can induce food-seeking behavior34. In this study, we show that the cVLMTH terminals in the PVT do not produce antinociception, and that LC terminals in the PVT do not induce food seeking. The most parsimonious explanation of these results is that different cVLMTH projections elicit specific responses through dedicated downstream circuits, although this does not exclude other explanations. We observed that a large proportion of cVLMTH neurons are activated by painful stimuli, and we saw a similar proportion of neurons stimulated by glucoprivation34. This suggests that there are no specific classes of ‘nociceptive’ neurons and that cVLM output may not be encoded by labeled lines. In the future, it will be interesting to examine the potential functions of cVLM projections, how they encode signals, as well as to investigate the nature of the different afferent inputs to the cVLM.
An unexplained feature of a number of descending pathways is the modality-specific inhibition produced when specific populations of neurons are activated. This phenomenon is apparently at odds with the modality-independent effects of global stimulation of the PAG, RVM or LC. Specifically, it has been reported that enkephalinergic RVM projection neurons modulate only mechanosensitive responses 45,46. In the PAG, excitatory and inhibitory neurons, depending on whether they are inhibited or excited, either affect only mechanosensensory or on both mechanosensory and heat responses47. Furthermore, manipulation of corticospinal neurons reduces mechanical but not heat sensitivity10. Our results show that the cVLM–LC–SC pathway is also modality specific; it only modifies responses to heat. It has been argued that these apparent paradoxical findings may result from the segregation, at many neural levels, of signals for thermal and mechanosensory nociception48-54. When artificial means are used to experimentally probe specific neural ensembles, this could result in responses not normally seen when the whole PAG, RVM or LC is stimulated, where likely multiple interconnected descending pathways are engaged. If this is the case, then in physiological settings the output of the cVLM pathway would be coordinated with other pathways to produce analgesia, explaining the apparent inconsistency of a LC–SC output on affecting only heat responses. Indeed, this explanation fits well with studies showing that global control of pain involves considerable interaction between descending LC noradrenergic and the RVM serotonergic systems2,55-57. Also, recent characterization of the LC has shown that it consists of apparent sub-domains that receive and transmit signals differently16. As well as anatomical heterogeneity within the LC, patterns of neural activity differ between sub-domains, and this divergent signaling may also explain the modality specificity of the cVLM–LC–SC pathway. Another interesting feature of the cVLM–LC–SC pathway is its slow deactivation rate. It is possible that this is because this pathway uses NA, which stimulates a slow deactivating metabotropic receptor signaling cascade58. This slow deactivation may occur in the spinal cord as we found no evidence in our slice physiology studies to suggest slow deactivation occurs in the LC. Interestingly, diffuse noxious inhibitory control produces slow inactivating spinal cord inhibition, and this has been shown to occur through NA mechanisms56.
By uncovering antinociception neurons in the medulla and the pathway they are part of, we redefine and update a key element in the supraspinal pain control systems. This module together, with other pain-control centers, regulate pain by gating primary sensory signals at the level of the spinal cord. We show that the cVLM–LC–SC pathway can elicit marked analgesia and contributes to counter-stimulus dependent analgesia. Therefore, targeting the cVLM pathway might provide a means to both investigate and treat pain.
Methods
Animals:
All experiments using mice followed NIH guidelines and were approved by the National Institute of Dental and Craniofacial Research ACUC. Mice were housed in small social groups (4-5 animals) in individually ventilated cages under 12-hour light/dark cycles and fed ad libitum. Animals of both sexes aged 7-12 weeks were used in experiments. C57Bl/6N wild-type mice were purchased from Envigo (Indianapolis, IN). TH-IRES-CreER mice (The Jackson Laboratory, stock #00852), TH-IRES-Cre mice (European Mouse Mutant Archive; stock #: EM:00254; backcrossed 5 generations with C57Bl/6NJ mice) and Ai9 reporter mice (The Jackson Laboratory, stock #007909) were bred in house. Animals were randomly allocated to the different experimental conditions reported in this study. Genotyping of offspring from all breeding steps was performed with genomic DNA isolated from tail snips.
Viral vectors:
AAV2/5-Ef1a-DIO hChR2(E123T/T159C)-EYFP, AAV1-hSyn-Cre, AAV9-CAG-FLEX-GCaMP6s-WPRE-SV40 and AAV9-hSyn-eGFP were obtained from the Vector Core of the University of Pennsylvania. AAV9-CAG-FLEX-tdTomato, AAV2-mCherry-FLEX-dtA, AAV9-hSyn-DIO-mCherry-2A-SybGFP, AAV2-hSyn-DIO-hM4Di-mCherry and AAV2-Syn-DIO-GFP were produced by the Vector Core of the University of North Carolina. AAVDJ-CAG-FLEX-TVA-mCherry was obtained from viral vector core at Salk Institute. AAVretro-CAG-GFP (Addgene # 37825-AAVrg), AAV1-CAG-FLEX-jGCaMP7s-WPRE (Addgene#104495-AAV1), AAV5-hSyn-FLEX-ChrimsonR-tdTomato (Addgene # 62723) and AAV2-hSyn-DIO-hM3D(Gq)-mCherry (Addgene #44361-AAV2) were produced by Addgene. AAV2(retro)-CAG-iCre (Addgene# 81070) was produced by Vector Biolabs. AAV2/9-hSyn-FLEX-TVA-P2A-EGFP-2A-oG and EnvA-SAD-ΔG-mCherry were gifts from Dr. Yuanyuan Liu at NIDCR/NIH. AAV8-CAG-FLEX-TCB (TVA-mCherry), AAV-EF1a-DIO-HB and EnvA-SAD-ΔG-GFP were obtained from GT3 Core Facility of the Salk Institute. All viral vectors were stored in aliquots at −80°C until use.
Anterograde tracing:
AAV1-hSyn-Cre and AAVretro-CAG-GFP were bilaterally injected into lumbar spinal cord of Ai9 mice26. Postsynaptic neurons of spinal projecting neurons in the brainstem were labeled with tdTomato by AAV1-mediated anterograde transsynaptic tagging27. Neurons labeled with both tdTomato and GFP are neurons projecting to lumbar spinal cord.
Retrograde tracing:
Three wild type mice received stereotaxic injections of FG (2.0%, Fluoro-Gold; Fluorochrome Inc.) in the LC and CTB (0.5% Cholera Toxin b subunit, LIST biological laboratories Inc.) in the PVT, respectively. Brain tissues were collected seven days after surgery and processed for histology. Antibodies against CTB (1:500, #703 / AB_2314252, LIST biological laboratories Inc.) and FG (1:50, Fluorochrome Inc.) were applied along with anti-TH antibodies to identify cVLM noradrenergic neurons that project to PVT (TH and CTB positive neurons) or LC (TH and FG positive neurons), and cVLM noradrenergic neurons which send collaterals to both.
Viral mediated knockout of TH:
A guide (GCCAAGGTTCATTGGACGGCGG) specific to TH was used to generate virus (AAV-CMV-FLEX-SaCas9-U6-sgRNA-TH) following the procedures described previously38. Virus were stereotaxically injected to LC of TH-IRES-Cre mice and behaviors were measured after three weeks.
Pseudotyped rabies virus tracing:
Helper AAVs (AAV2/9-hSyn-FLEX-TVA-P2A-EGFP-2A-oG, 200 nl/side) were bilaterally injected to LC of TH-IRES-Cre mice. The fluorescent reporter (EGFP), the avian receptor (TVA) and the rabies envelope glycoprotein (G) were specifically expressed in noradrenergic neurons in LC with a Cre-dependent manner. Pseudotyped rabies virus (EnvA-SAD-ΔG-mCherry, 200 nl/side) were bilaterally injected into the same location in LC two months later. The G-deficit pseudotyped rabies virus can only infect the noradrenergic neurons that expressed TVA receptor and glycoprotein G. The infectious viral particles generated in these noradrenergic neurons can trans-synaptically spread to presynaptic neurons which made mono-synaptic projection to LC noradrenergic neurons. For rabies virus tracing in cLVM, helper AAVs (AA8-CAG-FLEX-TCB and AAV-EF1a-DIO-HB) were unilaterally injected to cLVM, and Pseudotyped rabies virus (EnvA-SAD-ΔG-GFP, 200 nl) were injected four weeks later.
Drugs:
Clozapine N-oxide (CNO) (Abcam, catalog#ab141704) was used at a 0.75 mg/Kg dose when used in combination with the excitatory DREADDq and at 10 mg/Kg with inhibitory DREADDi virus. Estrogen receptor modulator, (Z)-4-Hydroxyamoxifen (Abcam, catalog#ab141943) was dissolved in corn oil at 20 mg/ml and a single intraperitoneal injection of 100 μl corn oil induced Cre-mediated recombination in TH-IRES-CreER mice. Capsaicin (Sigma, catalog #M2028) was dissolved in alcohol at 100 mg/ml and was diluted to 1 mg/ml working solution with PBS containing 5% Tween-20. Yohimbine hydrochloride was dissolved in DMSO and diluted to 1mg/ml working solution with PBS. AS19 (Tocris, catalog#1968) was dissolved in DMSO and diluted with PBS. Ondansetron hydrochloride (Tocris, catalog #2891, 10 μg), clonidine hydrochloride (Tocris, catalog #0690, 1nmol), AS19 (Tocris catalog #1968, 10 μg) were prepared with sterile PBS. The Complete Freund’s Adjuvant (CFA, Sigma, catalog#F5881,10 ul, subcutaneously injection) was used to induce inflammatory pain. 2-Deoxy-D-glucose (Tocris, catalog#4515, 500 mg/kg) was injected intraperitoneally into the mouse 30 minutes after CNO administration and 30 minutes before Hargreaves tests.
Antibodies:
Primary antibodies: anti-cFos (1:500, goat polyclonal, Santa Cruz catalog #sc-52-G; 1:50, rabbit monoclonal, Cell Signaling, catalog # 2250); anti-TH (1:1000, rabbit polyclonal, Emd millipore, catalog #AB152; 1:1000 mouse monoclonal, catalog #MAB5280 or 1:1000, Chicken polyclonal, Aveslabs, cataglog#TYH); anti-mCherry (1:1000, ThermoFisher Scientific, rabbit polyclonal ,catalog#PA5-34974); anti-GFP (1:500, Chicken polyclonal, Aveslabs, catalog#GFP-1020 or 1:1000, rabbit polyclonal, Emd millipore, catalog#AB3080). Fluorophore-conjugated secondary antibodies were purchased from ThermoFisher Scientific. Antibodies were diluted in PBS with 10% NGS and PBST.
Stereotaxic surgery:
All stereotaxic surgeries were conducted as described in our animal study protocol. Mice were anesthetized with a Ketamine/Xylazine solution (100mg/10mg in PBS) and a stereotaxic device (Stoelting, USA) was used for viral injections at the following stereotaxic coordinates: cLVM, -2.50 mm from Lambda, ±1.40 mm lateral from midline, and -5.30 mm vertical from cortical surface. LC, -5.50 mm from Bregma, 0.95 mm lateral from midline, and -3.50 mm vertical from cortical surface. PVT, -1.6 mm from Bregma, -0.06 mm lateral from midline with a 6-dgree angle, and -3.0 mm from cortical surface. AAVs were injected with an oil hydraulic micromanipulator (Narishige). AAVs were injected at a total volume of 0.1 μl in the cVLM. All other AAVs were injected at approximately 0.2-0.3 μl. Following stereotaxic injections, AAVs were allowed 2-3 weeks for maximal expression. Optical fibers with diameters of 200 μm (0.48 NA) and 400 μm (0.66 NA), were used for optogenetics and fiber photometry experiments, respectively (Doric Lenses). These fibers were implanted over the cLVM or LC immediately after viral injection and cemented using C&B Metabond Quick Adhesive Cement System (Parkell, Inc.). Mice received subcutaneous injections with Ketoprofen (5 mg/kg) for analgesia and anti-inflammatory purposes pre- and post-operatively and were allowed to recover on a heating pad.
Histology:
Mice were euthanized with CO2 and subsequently subjected to transcardiac perfusion with PBS and then with paraformaldehyde (PFA; 4% in PBS). Brains were then postfixed in 4% PFA at 4 °C overnight, and cryoprotected using a 30% PBS-buffered sucrose solution for ~24-36 h. Coronal brain sections (40 μm) were acquired using a cyrostat (CM1860, Leica). For immunostainings, brain sections were blocked in 10% normal goat serum (NGS) in PBST (0.3% Triton X-100 in PBS) for 1 hr at RT, followed by incubation with primary antibodies in 10% NGS-PBST for 24-48 hrs at 4 °C. Sections were then washed with PBST (3 × 15 min) and incubated with fluorescent secondary antibodies at RT for 1 h in 10% PBST. Sections were washed in PBS (3 × 15 min), mounted onto glass slides and cover-slipped with Fluoromount-G (Southern Biotech, catalog #0100-01). Images were taken using a Nikon C2+ confocal microscope (Nikon, Melville, NY). Image analysis and cell counting were performed using ImageJ software by a blinded experimenter (Fiji, version 2017 May 30).
Fos expression:
For cfos expression upon Capsaicin or ATP injection into plantar, mice were anaesthetized with isofluorane (2%) for 5 minutes. PBS containing 10 nmol of Capsaicin or 500 nmol of ATP were injected into left hind-paw of wild type mouse and, then mice were returned to home cage. Brain tissues were collected one hour after injection and subjected to cfos immunohistochemistry analysis. For cfos expression in mice with AAV2-DIO-DREADDq-mCherry virus injection, brain tissues were collected one hour after intraperitoneal injection of CNO.
In situ hybridization:
multi-label in situ hybridization was performed using the RNAscope® technology (ACD, Newark, CA) according to the manufacturer’s instructions. Probes against TH, DDC, DBH, PNMT, Slc18a2 (Vmat), Slc32a1 (Vgat), and Slc17a6 (Vglut2) in conjunction with the RNAscope® multiplex fluorescent development kit. Images were collected on a Nikon C2+ confocal laser-scanning microscope.
Bulk Ca2+ and Fiber photometry:
Fiber photometry procedures and calcium measurements were performed by following methods previously described34. Mice were first allowed to adapt to the experimental chambers and attached fiber patch cord for 60 min prior to each testing session. A fiber photometry system (Doric Lenses) was used to record fluorescence signals. The system is integrated with two continuous sinusoidally modulated LEDs (DC4100, ThorLabs) at 473 nm (211 Hz) and 405 nm (531 Hz) that served as light source to excite GCaMP6s and an isosbestic autofluorescence signal respectively. Fluorescence signals were collected by the same fiber implant that was coupled to a 400 μm optical patch-cord (0.48 NA) and focused onto two separate photoreceivers (2151, Newport Corporation). The RZ5P acquisition system (Tucker-Davis Technologies; TDT), equipped with a real-time signal processor controlled the LEDs and also independently demodulated the fluorescence brightness from 473 nm and 405 nm excitation. The LED intensity (ranging 10–15 μW) at the interface between the fiber tip and the animal was constant throughout the session. All photometry experiments were performed in behavioral chambers, square enclosure on hot plate (IITC Life Science) or mouse enclosures for Plantar Test Instrument (Ugo Basile). For ΔF/F analysis, a least-squares linear fit to the 405 nm signal to align it to the 470 nm signal was first applied. The resulting fitted 405 nm signal was then used to normalize the 473 nm as follows: ΔF/F = (473 nm signal – fitted 405 nm signal)/fitted 405 nm signal. For counter-stimulus experiments, mice were tested three times with 25 °C - 55 °C ramps, mice were given a 1-hour rest and then injected with capsaicin (counter stimulus). Next, a further three heat ramps trials were performed.
Combined optogenetic stimulation of LC-terminals and photometry of LCTH neurons:
We used one optical fiber as described for photometry experiments. This fiber was connected to a six-port fluorescence mini cube (DoricLens, Quebec, Canada) which allowed combined isosbestic excitation (400-410nm), GCaMP excitation (460-490nm) and emission (500-550nm), and red fluorophore excitation (540-570nm). Three light sources were employed, a 405nm-LED for isosbestic excitation, a 473nm-LED for GCaMP6s excitation and a 561 nm laser for Chrimson excitation. Two separate photoreceivers collected isosbestic and GCaMP6s signals (2151, Newport Corporation). The intensity of illumination from the 473nm LED was constant throughout the session and was adjusted to a minimal level to detect GCaMP6s signal (10–15 μW at the interface between the fiber tip). Activation of Chrimson was previously reported to occur from the excitation of GCaMP59, this effect would increase the baseline and reduce signal to noise ratio of GCaMP6s signals. Therefore, illumination for GCaMP6s was reduced to a minimum to decrease this effect.
Optogenetics:
TH-IRES-Cre mice injected with either Cre-dependent ChR2 or Cre-dependent GFP (control) in the cVLM and an optical fiber placed above cLVM were behaviorally tested three weeks later. Mice were tethered with an optical patch cord and placed in the perspex enclosure (10 cm x 10 cm x 15 cm) with free movements. After the habituation for 60 mins, Hargreaves test were performed to measure the baseline of hind-paw withdrawal latency. Then, mice received light stimulation with a blue LED light (470 nm, Thorlab M470F1) at a frequency of 20 Hz (10 ms width) for 2 min. Hargreaves tests were carried out to measure the hind-paw withdrawal latency during the stimulation and at 2 min, 5 min, 10 min, 20 min and 30 min after cessation of stimulation. For optical activation with Chrimson, a 561 nm laser (Opto Engine LLC, 561-50mW) was used to generate light stimulation at a frequency of 20 Hz (10 ms width) for 2 min during which Hargreaves tests were performed.
Mouse behavioral measurements
All behavioral experiments were conducted during the light cycle at ambient temperature (~23 °C). For all behavioral paradigms, the experimenter was blind to the genotype of mice under study. Ear-tag numbers were read after experiments and results unblinded after testing sessions.
Hargreaves Test:
Mice were habituated to the testing enclosures (Ugo Basile, Gemonio, Italy) for 60 min. Habituation was repeated for 2 days. On testing day, after the mice were acclimatized for 60 min in the testing enclosure, a radiant heat beam was applied to the center of the hind paw and reaction time between the start of the heat stimuli and lifting the hind-paw were recorded as the hind-paw withdrawal latency. A cut-off time of 15 s was used to prevent tissue damage. Consecutive tests of the same paw were separated by at least 3 minutes. The test was repeated for 5 trials for both left and right hind-paws. The averages of the withdrawal latencies were calculated. Mild burn was achieved by placing the hind paw, while mice were deeply anesthetized, in a water bath at 55°C for 15 s.
Cold plantar test:
Cold responses were tested as described previously60. Briefly, a dry ice pellet was applied below the hind paw of a mouse sitting on a glass surface and time to withdrawal was measured. Withdrawal was tested 5 times for each hind paw, consecutive tests of the same paw were separated by at least 3 minutes.
Itch test:
Behavioral assessment of scratching behavior was conducted as described previously50. Briefly, mice were injected subcutaneously into the nape of the neck with chloroquine. Compounds were diluted in PBS. Scratching behavior was recorded for 30 minutes and is presented in numbers of bouts observed in 30 minutes. One bout was defined as scratching behavior towards the injection site between lifting the hind leg from the ground and either putting it back on the ground or guarding the paw with the mouth. Injection volume was always 10 μl.
Von Frey test:
Mechanical sensitivity thresholds were assessed using calibrated von Frey filaments employing the simplified up-down method. Animals were acclimatized in a plastic cage with a wire mesh floor for 1 hour and then tested with von Frey filaments with logarithmically incremental stiffness (starting with 0.4g). Each filament was applied for 5 sec, and the presence or absence of a withdrawal response was noted. The filament with the next incremental stiffness was then applied, depending on the response to the previous filament, and this was continued until there had been 6 positive responses. The filaments were applied to the glabrous skin on the hind paw, and a positive response was recorded when there was lifting or flinching of the paw. The force required for 50% withdrawal was determined by the up-down method.
Rota-rod test:
Motor coordination was tested by measuring the performance on an accelerating rota-rod (IITC life Science, CA) with the rod programmed to accelerate from 4 to 40 rpm over 5 mins. During the experimental testing session, the mice were allowed two trial runs followed by 4 test runs and the average of the maximum rpm tolerated was recorded. For each mouse, the ratio of maximum
Hot plate test:
Hot plate test (IITC life Science, CA) were used to assess the nociception upon high temperature stimulus. The latency to lick a hind-paw when the mouse was placed on a 52.0°C was measured. The plate was enclosed with four Plexiglas walls and a lid so that mouse could not escape. The mouse was removed from the plate after 30 seconds.
Randall–Selitto test:
A modified Randall-Selito device (IITC Life Sciences) was used to automatically measure the responses when pressure was applied to the tail. Mouse was placed into a mouse restrainer with the tail exposed for the access of hand-held probe. Pressure was applied to the tail until response was observed. The maximum force applied during the test was recorded.
Feeding behavior:
As described in previous paper34, TH-IRES-Cre mice injected with either Cre-dependent ChR2 or Cre-dependent mCherry (control) in the VLM and an optical fiber placed above the pPVT or LC were behaviorally tested 3 weeks later. First, mice were tethered with an optical patch cord and placed in an open-field box (45 × 45 × 40 cm) where they were given access to 20 mg food pellets for 30 min (Pre-test). Immediately after the pre-test, mice received light stimulation with a blue laser tuned at 473 nm at a frequency of 20 Hz (duration 10 ms) for 30 min using a 1 min “ON” 2 min “OFF” protocol (Stimulation). After light stimulation, mice were given another 30 min with access to food (Post-test). In addition, for these mice, the duration, quantity, and timing of feeding epochs were quantified using a custom designed feeding experimentation device (FED3). The power of blue laser for all experiments was 5–10 mW, measured at tip of the patch chord.
Bulk Ca2+ recordings in brain slice:
TH-IRES-Cre mice were bilaterally injected with AAV5-Syn-FLEX-ChrimsonR-tdTomato virus in cLVM (100 nl/side) and AAV1-CAG-FLEX-jGCaMP7s-WPRE in LC (200 nl/side). Three to four weeks later, mice were anesthetized with isoflurane and transcardiacally perfused with ice-cold NMDG artificial cerebrospinal fluid (ACSF) (92 mM NMDG, 2.5 mM KCl, 1.25 mM NaH2PO4, 30 mM NaHCO3, 20 mM HEPES, 20 mM glucose, 2 mM thiourea, 5 mM Na-ascorbate, 3 mM Na-pyruvate, 0.5 mM CaCl2·4H2O and 10 mM MgSO4·7H2O. Titrate pH to 7.3–7.4 with concentrated hydrochloric acid). Coronal sections containing LC (300 μm thick) were sectioned with a VT1200S automated vibrating-blade microtome (Leica Biosystems) and were subsequently transferred to incubation chamber containing NMDG ACSF (34–35 °C). After 12 minutes recovery, slices were transferred to a modified ACSF (92 mM NaCl, 2.5 mM KCl, 30 mM NaHCO3, 1.25 mM NaH2PO4, 25 mM glucose, 20 mM HEPES, 2 mM thiourea, 5 mM Na-ascorbate, 3 mM Na-pyruvate, 2 mM MgSO4, and 2 mM CaCl2, pH 7.4, gassed with 95% O2 and 5% CO2) at room temperature (20–24 °C) and remained until imaged. For imaging, slices were placed in the recording chamber containing ACSF (118 mM NaCl, 2.5 mM KCl, 26.2 mM NaHCO3, 1 mM NaH2PO4, 20 mM glucose, 2 mM MgCl2, and 2 mM CaCl2, at 20-24°C, pH 7.4, gassed with 95% O2 and 5% CO2) and remained there until imaging finished. Images were obtained using fluorescence microscope (Olympus BX51 microscope) with an Orca Flash 4.0 LT camera and HCImage Live (Hamamatsu Corporation, PA) software at two images per second. Light stimulation was achieved using a red laser (635 nm) delivered in 20Hz for 20 seconds to activate Chrimson. A LED (Lumen 300-LED, Prior Scientific) was used to activate jGCaMP7s. Images obtained before light stimulation served as baseline, and the fluorescence changes of jGCaMP7s after light stimulation were analyzed with ImageJ software. TTX (1uM) and 4-AP (100 uM) were applied to isolate the monosynaptic response. To isolate the noradrenergic or glutamatergic effects on GCaMP responses, initial recordings were made in ACSF to establish a baseline response, then selective antagonists were bath applied. For slices from three different mice, we bath applied the β-adrenergic receptor antagonist propranolol (10 μM) and recorded GCaMP responses at least 10 minutes after initial application of the antagonist. For slices from a separate set of three mice, we simultaneously bath-applied the AMPA receptor agonist NBQX (10 μM) and the NMDA receptor antagonist AP5 (50 μM) and recorded GCaMP responses after at least 10 min had passed since initial application of the antagonists. All antagonists were purchased from Tocris (Bio-Techne).
Statistics and Reproducibility:
Prism 8.0 (GraphPad Software, La Jolla, CA) was used for statistical analyses. Differences between mean values were analyzed using unpaired two-tailed Student’s t-test. Differences were considered significant for *p < 0.05, **p<0.001, ***p<0.001 and exact p-values are given in the respective figure legend. No statistical method was employed to predetermine sample sizes. No statistical methods were used to pre-determine sample sizes, but our sample sizes are similar to those reported in previous publications10, 15, 34, 47. Data distribution was assumed to be normal but was not formally tested. Data collection and analyses were not performed blind to the conditions of the experiment and randomization was not used. No data was excluded from data analysis except where posthoc analysis revealed viral transgene expression was absent in the intended site of injection and where animals were removed from study for humane health reasons. Both criteria were pre-established.
Extended Data
Extended Data Figure 1. cVLMTH-neurons are catecholaminergic.
Related to Fig 1. A. Representative magnified images, from mice treated with capsaicin, of ventral lateral medulla regions where tyrosine hydroxylase immune-positive neurons (magenta) are found. In control mice, intraplantar application of capsaicin to the hind-paw induced cfos expression (green) prominently in TH-positive neurons. By contrast this treatment, in Trpv1 knockout (Trpv1KO) mice resulted in expression of few cfos-positive neurons. Scale bars: 50 μm. B. Quantification of cfos expression in TH-neurons, n=6 control mice and n=3 Trpv1KOmice (Trpv1KO ipsilateral 94/304, Trpv1KO contralateral 92/278; WT ipsilateral 341/452, WT contralateral 219/404), data are presented as mean ± SEM. C. Multilabel ISH of cVLMTH neurons revealed that the majority of these neurons express DDC and DBH. Scale bars: 50 μm. D. Multilabel ISH of cVLMTH neurons revealed that the majority of these neurons express monoamine transporter Vmat (Slc18a2) but not adrenaline synthesizing enzyme PNMT. Scale bars: 50 μm. E. Quantification of the expression of DDC and DBH with TH; from 239 TH+-neurons there were 239 TH-DCC+, 237 TH-DBH+-cells, n=3 mice. And quantification of the expression of Vmat and PNMT with TH; from 239 TH+-neurons there were 239 TH-Vmat+, 0 TH-PNMT+-cells, n=3 mice, data are presented as mean ± SEM. F. Using spinal cord injection of AAV1-hSyn-Cre in Ai9 reporter mice together with injection of AAVretro-CAG-GFP, labeled spinal cord anterograde neurons (labeled magenta - tdT) and retrograde labeled spinal cord projecting neurons (labeled green - GFP). Section from caudal medulla (approx. -7.8 Bregma) showed scattered spinal cord anterograde neurons in the cVLM (circled), nucleus of the solitary tract (NTS), and inferior olive complex (IO). Concentrated axonal labeling of corticospinal neurons was seen in the pyramid (py). G. Section from the rostral medulla (approx. -5.7 Bregma) showed anterograde and retrograde labeled neurons in the rostral ventral medulla as well as axonal labeling of corticospinal neurons in the pyramid (py). H. Monosynaptic rabies tracing from cVLMTH-neurons did not reveal pre-synaptic neurons in the spinal cord. I. Adjacent to cVLMTH-starter neurons (red- helper virus and blue TH-immuno-stained) in the medulla were retrograde labeled neurons (green -rabies virus). Note, all red helper virus labeled neurons were TH-positive. However, we note that these neurons could potentially constitute artefacts as non-specific labeled neurons have been reported adjacent to the site of helper virus injections61.
Extended Data Figure 2. Photometry of cVLMTH-neurons to mild somatosensory stimuli.
Related to Fig 2. A. Heatmap traces from 3 individual animals to tail clip. B-E. Averaged intracellular calcium responses, using in vivo fiber photometry, of cVLMTH neurons. Responses to mild mechanical with brush to hind-paw (B), von Frey filament on plantar surface of hind-paw (C), localized heating (Hargreaves test on plantar surface of hind-paw) (D), and cold plate stimulation (E) show, only modest increases in intracellular calcium in cVLMTH neurons; n=6 mice, data are represented as mean results (blue) ± SEM (grey). Quantification of the AUC for measurements are shown to the right of each data set and showed that compared to baseline responses, GCaMP6s responses were not significantly different, p=0.67, p=0.997, p=0. 40, p=0.31, respectively for panels B-E, two-sided unpaired t-test. Box chart legend: box is defined by 25th, 75th percentiles, whiskers are determined by maximum and minimum, horizontal line represents the mean.
Extended Data Figure 3. Control chemogenetic activation and inhibition of cVLMTH-neurons.
Related to Fig 2 A. Injection of AAV22-hSyn-DIO -GFP into TH-CreER mice did not alter CNO evoked behavioral responses in Hargreaves tests, n= 6 mice, p=0.4031 for left L and p=0.47, two-sided unpaired t-test, data are presented as mean ± SEM. B. For both male and female mice, withdrawal latencies were significantly increased, in Hargreaves tests, after chemogenetic activation of cVLMTH neurons (CNO administration) compared to saline injected mice (L and R indicate left and right hind-paws respectively), n=8 male mice, p=0.0004 for L and p<0.0001 for R hind-paws; n=8 female mice, p=0.0016 for L and t=7.35, p=0.0002 for R hind-paws, two-sided paired t-test, data are presented as mean ± SEM. data represent means ± SEM. There were no significant differences in responses between male and female mice, p=0.63 for L and p = 0.95 for R hind-paws, two-sided unpaired t-testdata are presented as mean ± SEM. C. Hargreaves test responses of mice before and after administration of tamoxifen (to induce translocation of CreERT2 and recombination) were not significantly different, n=8 mice, p=0.42 for L and p=0.089 for R hind-paws, two-sided paired Student T-test, data are presented as mean ± SEM. D. For both male and female mice withdrawal latencies were significantly decreased, in Hargreaves tests, after chemogenetic inhibition of cVLMTH neurons (CNO administration) compared to saline injected mice, n=3 male, p=0.041 for L and p=0.023 for R hind-paws; n=8 female mice, p=0.0026 for L and p=0.0033 for R hind-paws, two-sided paired t-test, data are presented as mean ± SEM. There were no significant differences in responses between male and female mice. p=0.072 for L and, p=0.38 for R hind-paws. E. Hargreaves test responses of mice before and after administration of tamoxifen. The were no significant differences between treatment groups, n=5, p=0.30 for L and p=0.078 for R hind-paws, two-sided unpaired t-test, Data are presented as mean ± SEM.
Extended Data Figure 4. Effects of chemogenetic activation of cVLMTH-neurons on itch, touch, cold, motor co-ordination and body temperature.
Related to Fig 2. A-F Analysis of behavioral responses in TH-CreER mice injected unilaterally in the cVLM with AAV2-hSyn-DIO-hM3D(Gq)-mCherry and tested in behavioral assays following chemogenetic activation of cVLMTH-neurons (CNO). A. Number of scratching bouts over 30 minutes to intradermal injection of chloroquine (200 μg) in the nape of the neck was not significantly different between treatment groups (±CNO) n=8 mice, p=0.76, two-sided paired t-test, data are presented as mean ± SEM. B. Threshold responses to von Frey filament stimulation was not significantly different between treatment groups (±CNO) n=8 mice, p=0.095 for L and p=0.80 for R hind-paws, two-sided paired t-test, data are presented as mean ± SEM.C. Mechanical pinch responses (Randal Selitto method) were not significantly different between treatment groups (±CNO) n=8 mice, p=0.47, , two-sided paired t-test, data are presented as mean ± SEM. D. Latencies for withdrawal in plantar reflex responses to cold stimulation were not significantly different between treatment groups (±CNO) n=8 mice, p=0.11 for L and p=0.796 for R hind-paws,, two-sided paired t-test, data are presented as mean ± SEM. E. Motor coordination was not significantly different between treatment groups (±CNO) n=8 mice, p=0.43, two-sided paired t-test, data are presented as mean ± SEM.. F. Core body temperature measured with a rectal thermal probe was not significantly different between treatment groups (±CNO) n=5 mice, p=0.58, two-sided paired t-test, data are presented as mean ± SEM.
Extended Data Figure 5. Effects of chemogenetic inhibition of cVLMTH-neurons on itch, touch, cold, motor co-ordination and body temperature.
Related to Fig 2. A-F Analysis of behavioral responses in TH-CreER mice injected unilaterally in the cVLM with AAV2-hSyn-DIO-hM4D(Gi)-mCherry and tested in behavioral assays following chemogenetic inhibition of cVLMTH neurons (CNO). A. Number of scratching bouts over 30 minutes to intradermal injection of chloroquine (200μg) in the nape of the neck was not significantly different between treatment groups (±CNO) n=6 mice, p=0.83, two-sided paired t-test, data are presented as mean ± SEM. B, Threshold responses to von Frey filament stimulation was not significantly different between treatment groups (±CNO) n=11 mice, p=0.30 for L and p=0.55 for R hind-paws, two-sided paired t-test, data are presented as mean ± SEM. C. Mechanical pinch responses (Randal Selitto method) were not significantly different between treatment groups (±CNO) n=6 mice, p=0.75, two-sided paired t-test, data are presented as mean ± SEM. D. Latencies for withdrawal in plantar reflex responses to cold stimulation were not significantly different between treatment groups (±CNO) n=5 mice, p=0.64 for L and p=0.08 for R hind-paws, , two-sided paired t-test, data are presented as mean ± SEM. E. Motor coordination was not significantly different between treatment groups (±CNO) n=5 mice, p=0.28 for light ON and p=0.13 for R hind-paws, two-sided paired t-test, data are presented as mean ± SEM. F. Core body temperature measured with a rectal thermal probe was not significantly different between treatment groups (±CNO) n=6 mice, p=0.41, two-sided paired t-test, data are presented as mean ± SEM.
Extended Data Figure 6. Innervation of LC by cVLMTH-neurons.
Related to Fig 3. A-F. Representative images of the pattern of fiber projections from TH-Cre mice injected in the cVLM with AAV9-hSyn-DIO-mCherry-2A-SybGFP, showing synaptic boutons (green) on projecting axons and TH-staining of LC-neurons (blue), n=3 mice. A-C. Representative image of a sagittal section of the hindbrain showing cVLMTH neuron projections to the LC. D-F. Magnified view of LC. Scale bars, 500 μm in A-C and 50 μm in D-F. 3V indicates third ventricle.
Extended Data Figure 7. Innervation of PVT, PVN, BNST, and PAG by cVLMTH-neurons.
Related to Figure 3. A-G. Representative images of the pattern of fiber projections of TH-Cre mice injected in the cVLM with AAV2-Syn-DIO-TVA-mCherry, showing labeled fibers (magenta), n=3 mice. A. Representative image of a coronal section of the midbrain showing cVLMTH neuron projections to the PVT and PVN. B. Section through midbrain showing cVLMTH neuron projections to the BNST. C. Section of the hindbrain showing cVLMTH neuron projections to the PAG. D and E. Magnified view of boxed areas in A. F. Magnified view of boxed areas in B. G. Magnified view of boxed areas in C. Scale bars: 1 mm in A-C and 100 μm in D-G. 3V, LV, D3V, and Aq indicate the third ventricle, lateral ventricle, dorsal third ventricle, and aqueduct respectfully.
Extended Data Figure 8. cVLMTH-neurons trigger PVT dependent food-seeking but not analgesia.
Related to Figure 5-6. A-B. Feeding behavior was measured during optogenetic stimulation of VLM terminals in either the LC or in the pPVT. Food intake was quantified in well-fed mice prior to, during and after light stimulation (30 min, pre-test, stimulation and post-test). The stimulation protocol consisted of 30 mins in which light stimulation alternated between 1 min “light ON” (20Hz) and 2 min “light OFF” bouts. A. Plot of individual performance on feeding behavior during the pre-test, stimulation and post-test for ChR2 (VLM-ChR2) mice. B. Quantification of feeding behavior during VLM-LC and VLM–pPVT stimulation for ChR2 mice. Total food intake in grams, VLM-LC: Pre-Test, 0.048 ± 0.01; Stimulation, 0.035 ± 0.02; Post-Test, 0.06 ± 0.01, n = 8 mice; F (2,23) = 0.623, one-way ANOVA followed by Tukey’s test. Group comparisons: Pre-Test vs Stimulation, p=0.811; Post-Test vs Stimulation, p=0.483. for VLM-PVT: Pre-Test, 0.116 ± 0.07; Stimulation, 0.429 ± 0.11; Post-Test, 0.115 ± 0.05, n = 12 mice; F (2,35) = 6.27, one-way ANOVA followed by Tukey’s test. Group comparisons: Pre-Test vs Stimulation, p=0.02; Post-Test vs Stimulation, p=0.04. Box chart legend: box is defined by 25th, 75th percentiles, whiskers are determined by maximum and minimum, horizontal lines represent the mean. C. Hargreaves behavioral responses to optogenetic stimulation of VLM terminals in the PVT of TH-Cre mice injected bilaterally with AAV-FLEX-Chrimson. Stimulation did not significantly alter hind-paw withdrawal latency, n= 6 mice, p=0.42 and p=0.28 for L and R respectively, two-sided paired t-test, data are presented as mean ± SEM. DE. cVLMTH neurons project collaterally to the PVT and the LC. Retrograde tracers were injected into the PVT (CTB, magenta) and the LC (Fluoro-Gold (FG) green). D. Quantification of results from three animals, data represent means ± SEM. TH+ neurons, n = 440; TH+CTB+ neurons, n = 161; TH+ G+ neurons, n = 107; TH+CTB+FG+ neurons, n = 55. CTB&FG / CTB only + FG only + CTB&FG = 25.6 ± 9.1 mean ± SEM. E. Representative image of the cVLM showing PVT-projecting cVLMTH neurons (TH+CTB+), LC-projecting cVLMTH neurons (TH+FG+) and PVT/LC projecting cVLMTH neurons (TH+CTB+FG+). F. Glutamate receptors antagonists NBQX and AP5 inhibit cVLMTH-mediated optogenetic responses in the LC, but β-adrenergic receptor antagonist Propranolol did not. Z-scores were calculated by using the mean and standard deviation of baseline fluorescence before optical stimulation. Data are presented as the average intensity peak of jGCaMP7s fluorescence relative to baseline fluorescence. Peak intensity of jGCaMP7s fluorescence for ACSF, and for ACSF with glutamate receptor antagonists, p< 0.0001, n = 42 neurons from three animals, two-sided unpaired t-test, data are presented as mean ± SEM. G. Peak intensity of jGCaMP7s fluorescence for ACSF, for ACSF with beta blocker Propranolol, p=0.23, n = 36 neurons from three animals, two-sided unpaired t-test, data are presented as mean ± SEM.
Extended Data Figure 9. Controls for optogenetic activation of terminals of cVLMTH-neurons in the LC.
Related to Figure 7. A. Experimental paradigm used to examine the influence of spinal cord NA on cVLMTH neuron induced antinociceptive effects. B. Optogenetic activation of cVLMTH neuron fiber terminals in the LC induced increased withdrawal latencies in Hargreaves test which were significantly attenuated by intrathecal administration of yohimbine, n=8 mice, p=0.0001 for L and p=0.017 for R hind-paws respectivelytwo-sided paired t-test, data represent means ± SEM. C. Serotonin 5-hydroytryptamine type 3 (5-HT3) receptor antagonist ondansetron (suggested to be responsible, in part, for descending facilitation of pain from the RVM) had no effect on CNO-induced pronociception elicited by chemogenetic inhibition of cVLMTH neuron, n=7 mice, p=0.49 for L and p=0.17 for R hind-paws. D. Similarly, 5-hydroytryptamine type 7 (5-HT7) receptor agonist, AS19 (thought to be responsible, in part, for the descending inhibition of pain from the RVM) also did not affect CNO-induced pronociception, n=7 mice, p=0.59 for L and p=0.0.20 for R hind-paws,two-sided paired t-test, data are presented as mean ± SEM.
Extended Data Figure 10. Controls for photometry measurements of pain induced analgesia.
Related to Figure 8. A. Representative example of calcium responses of cVLMTH neurons, measured using in vivo fiber photometry, from a single mouse to repeated noxious heat stimulation (on a hot plate; temperature ramps indicated above trace) before and after injection of capsaicin counter-stimulus into the fore paw (indicated with red arrow). A 1-hour rest period was included between naïve and counter-stimulus trials. B. Behavioral responses to heat challenge (heat ramp to 55 °C) on a hot plate before and after injection of capsaicin in the forepaw; latency to first lick (left columns). There was a significant difference between trial groups for first lick (± capsaicin), n=6 mice, p=0.043, two-sided paired t-test, data are presented as mean ± SEM.
C. Averaged in vivo photometry responses of cVLMTH neurons for three trials (averaged) before and after a 1-hour rest period to heat challenges (3 x heat ramp to 55 °C) on a hot plate, showed that averaged responses were not altered to repeated noxious thermal insult or by the 1-hour rest period.
Acknowledgments
We thank Alena Hoover, and Erich Henry, for their help in collecting preliminary data. This work was supported by the intramural research program of the National Institute of Dental and Craniofacial Research, National Institutes of Health, project ZIADE000721-20 (MAH) and National Institute of Mental Health, (MP).
Footnotes
Competing interests
We declare no competing interests.
Data availability
All data in this manuscript has been deposited as open source database, doi:10.5061/dryad.kkwh70s82.
References
- 1.Basbaum AI & Fields HL Endogenous pain control systems: brainstem spinal pathways and endorphin circuitry. Annu Rev Neurosci 7, 309–338, doi: 10.1146/annurev.ne.07.030184.001521 (1984). [DOI] [PubMed] [Google Scholar]
- 2.Heinricher MM, Tavares I, Leith JL & Lumb BM Descending control of nociception: Specificity, recruitment and plasticity. Brain Res Rev 60, 214–225, doi: 10.1016/j.brainresrev.2008.12.009 (2009). [DOI] [PMC free article] [PubMed] [Google Scholar]
- 3.Basbaum AI, Bautista DM, Scherrer G & Julius D Cellular and molecular mechanisms of pain. Cell 139, 267–284, doi:S0092-8674(09)01243-4 [pii] 10.1016/j.cell.2009.09.028 (2009). [DOI] [PMC free article] [PubMed] [Google Scholar]
- 4.Alhadeff AL et al. A Neural Circuit for the Suppression of Pain by a Competing Need State. Cell 173, 140–152 e115, doi: 10.1016/j.cell.2018.02.057 (2018). [DOI] [PMC free article] [PubMed] [Google Scholar]
- 5.Bodnar RJ, Kelly DD, Brutus M, Mansour A & Glusman M 2-Deoxy-D-glucose-induced decrements in operant and reflex pain thresholds. Pharmacol Biochem Behav 9, 543–549, doi: 10.1016/0091-3057(78)90056-4 (1978). [DOI] [PubMed] [Google Scholar]
- 6.Fields HL Pain modulation: expectation, opioid analgesia and virtual pain. Prog Brain Res 122, 245–253, doi: 10.1016/s0079-6123(08)62143-3 (2000). [DOI] [PubMed] [Google Scholar]
- 7.Reynolds DV Surgery in the rat during electrical analgesia induced by focal brain stimulation. Science 164, 444–445, doi: 10.1126/science.164.3878.444 (1969). [DOI] [PubMed] [Google Scholar]
- 8.Mayer DJ & Liebeskind JC Pain reduction by focal electrical stimulation of the brain: an anatomical and behavioral analysis. Brain Res 68, 73–93, doi: 10.1016/0006-8993(74)90534-4 (1974). [DOI] [PubMed] [Google Scholar]
- 9.Gebhart GF Descending modulation of pain. Neurosci Biobehav Rev 27, 729–737, doi: 10.1016/j.neubiorev.2003.11.008 (2004). [DOI] [PubMed] [Google Scholar]
- 10.Liu Y. et al. Touch and tactile neuropathic pain sensitivity are set by corticospinal projections. Nature 561, 547–550, doi: 10.1038/s41586-018-0515-2 (2018). [DOI] [PMC free article] [PubMed] [Google Scholar]
- 11.Tavares I & Lima D The caudal ventrolateral medulla as an important inhibitory modulator of pain transmission in the spinal cord. J Pain 3, 337–346, doi: 10.1054/jpai.2002.127775 (2002). [DOI] [PubMed] [Google Scholar]
- 12.Borsook D. Pain: the past, present and future. Adv Drug Deliv Rev 55, 931–934, doi: 10.1016/s0169-409x(03)00096-6 (2003). [DOI] [PubMed] [Google Scholar]
- 13.Tavares I, Lima D & Coimbra A The ventrolateral medulla of the rat is connected with the spinal cord dorsal horn by an indirect descending pathway relayed in the A5 noradrenergic cell group. J Comp Neurol 374, 84–95, doi: (1996). [DOI] [PubMed] [Google Scholar]
- 14.Hickey L. et al. Optoactivation of locus ceruleus neurons evokes bidirectional changes in thermal nociception in rats. J Neurosci 34, 4148–4160, doi: 10.1523/JNEUROSCI.4835-13.2014 (2014). [DOI] [PMC free article] [PubMed] [Google Scholar]
- 15.Hirschberg S, Li Y, Randall A, Kremer EJ & Pickering AE Functional dichotomy in spinal- vs prefrontal-projecting locus coeruleus modules splits descending noradrenergic analgesia from ascending aversion and anxiety in rats. Elife 6, doi: 10.7554/eLife.29808 (2017). [DOI] [PMC free article] [PubMed] [Google Scholar]
- 16.Chandler DJ et al. Redefining Noradrenergic Neuromodulation of Behavior: Impacts of a Modular Locus Coeruleus Architecture. J Neurosci 39, 8239–8249, doi: 10.1523/JNEUROSCI.1164-19.2019 (2019). [DOI] [PMC free article] [PubMed] [Google Scholar]
- 17.Schwarz LA et al. Viral-genetic tracing of the input-output organization of a central noradrenaline circuit. Nature 524, 88–92, doi: 10.1038/nature14600 (2015). [DOI] [PMC free article] [PubMed] [Google Scholar]
- 18.Bullitt E Expression of c-fos-like protein as a marker for neuronal activity following noxious stimulation in the rat. J Comp Neurol 296, 517–530, doi: 10.1002/cne.902960402 (1990). [DOI] [PubMed] [Google Scholar]
- 19.Lanteri-Minet M, Weil-Fugazza J, de Pommery J & Menetrey D Hindbrain structures involved in pain processing as revealed by the expression of c-Fos and other immediate early gene proteins. Neuroscience 58, 287–298, doi: 10.1016/0306-4522(94)90035-3 (1994). [DOI] [PubMed] [Google Scholar]
- 20.Gebhart GF & Ossipov MH Characterization of inhibition of the spinal nociceptive tail-flick reflex in the rat from the medullary lateral reticular nucleus. J Neurosci 6, 701–713 (1986). [DOI] [PMC free article] [PubMed] [Google Scholar]
- 21.Janss AJ & Gebhart GF Spinal monoaminergic receptors mediate the antinociception produced by glutamate in the medullary lateral reticular nucleus. J Neurosci 7, 2862–2873 (1987). [DOI] [PMC free article] [PubMed] [Google Scholar]
- 22.Foong FW & Duggan AW Brain-stem areas tonically inhibiting dorsal horn neurones: studies with microinjection of the GABA analogue piperidine-4-sulphonic acid. Pain 27, 361–371, doi: 10.1016/0304-3959(86)90160-0 (1986). [DOI] [PubMed] [Google Scholar]
- 23.Hall JG, Duggan AW, Morton CR & Johnson SM The location of brainstem neurones tonically inhibiting dorsal horn neurones of the cat. Brain Res 244, 215–222, doi: 10.1016/0006-8993(82)90080-4 (1982). [DOI] [PubMed] [Google Scholar]
- 24.Tavares I & Lima D Descending projections from the caudal medulla oblongata to the superficial or deep dorsal horn of the rat spinal cord. Exp Brain Res 99, 455–463, doi: 10.1007/BF00228982 (1994). [DOI] [PubMed] [Google Scholar]
- 25.Hokfelt T, Johansson O & Goldstein M Chemical anatomy of the brain. Science 225, 1326–1334, doi: 10.1126/science.6147896 (1984). [DOI] [PubMed] [Google Scholar]
- 26.Madisen L. et al. Transgenic mice for intersectional targeting of neural sensors and effectors with high specificity and performance. Neuron 85, 942–958, doi: 10.1016/j.neuron.2015.02.022 (2015). [DOI] [PMC free article] [PubMed] [Google Scholar]
- 27.Zingg B. et al. AAV-Mediated Anterograde Transsynaptic Tagging: Mapping Corticocollicular Input-Defined Neural Pathways for Defense Behaviors. Neuron 93, 33–47, doi: 10.1016/j.neuron.2016.11.045 (2017). [DOI] [PMC free article] [PubMed] [Google Scholar]
- 28.Fields HL, Malick A & Burstein R Dorsal horn projection targets of ON and OFF cells in the rostral ventromedial medulla. J Neurophysiol 74, 1742–1759, doi: 10.1152/jn.1995.74.4.1742 (1995). [DOI] [PubMed] [Google Scholar]
- 29.Pop IV et al. Structure of Long-Range Direct and Indirect Spinocerebellar Pathways as Well as Local Spinal Circuits Mediating Proprioception. J Neurosci 42, 581–600, doi: 10.1523/JNEUROSCI.2157-20.2021 (2022). [DOI] [PMC free article] [PubMed] [Google Scholar]
- 30.Bernard JF & Besson JM The spino(trigemino)pontoamygdaloid pathway: electrophysiological evidence for an involvement in pain processes. J Neurophysiol 63, 473–490, doi: 10.1152/jn.1990.63.3.473 (1990). [DOI] [PubMed] [Google Scholar]
- 31.Woulfe JM, Hrycyshyn AW & Flumerfelt BA Collateral axonal projections from the A1 noradrenergic cell group to the paraventricular nucleus and bed nucleus of the stria terminalis in the rat. Exp Neurol 102, 121–124, doi: 10.1016/0014-4886(88)90084-2 (1988). [DOI] [PubMed] [Google Scholar]
- 32.Jones SL & Gebhart GF Characterization of coeruleospinal inhibition of the nociceptive tail-flick reflex in the rat: mediation by spinal alpha 2-adrenoceptors. Brain Res 364, 315–330, doi: 10.1016/0006-8993(86)90844-9 (1986). [DOI] [PubMed] [Google Scholar]
- 33.Westlund KN, Zhang D, Carlton SM, Sorkin LS & Willis WD Noradrenergic innervation of somatosensory thalamus and spinal cord. Prog Brain Res 88, 77–88 (1991). [DOI] [PubMed] [Google Scholar]
- 34.Sofia Beas B. et al. A ventrolateral medulla-midline thalamic circuit for hypoglycemic feeding. Nat Commun 11, 6218, doi: 10.1038/s41467-020-19980-7 (2020). [DOI] [PMC free article] [PubMed] [Google Scholar]
- 35.Petreanu L, Mao T, Sternson SM & Svoboda K The subcellular organization of neocortical excitatory connections. Nature 457, 1142–1145, doi: 10.1038/nature07709 (2009). [DOI] [PMC free article] [PubMed] [Google Scholar]
- 36.Bruinstroop E. et al. Spinal projections of the A5, A6 (locus coeruleus), and A7 noradrenergic cell groups in rats. J Comp Neurol 520, 1985–2001, doi: 10.1002/cne.23024 (2012). [DOI] [PMC free article] [PubMed] [Google Scholar]
- 37.Kim EJ, Jacobs MW, Ito-Cole T & Callaway EM Improved Monosynaptic Neural Circuit Tracing Using Engineered Rabies Virus Glycoproteins. Cell Rep 15, 692–699, doi: 10.1016/j.celrep.2016.03.067 (2016). [DOI] [PMC free article] [PubMed] [Google Scholar]
- 38.Hunker AC et al. Conditional Single Vector CRISPR/SaCas9 Viruses for Efficient Mutagenesis in the Adult Mouse Nervous System. Cell Rep 30, 4303–4316 e4306, doi: 10.1016/j.celrep.2020.02.092 (2020). [DOI] [PMC free article] [PubMed] [Google Scholar]
- 39.Dogrul A, Ossipov MH & Porreca F Differential mediation of descending pain facilitation and inhibition by spinal 5HT-3 and 5HT-7 receptors. Brain Res 1280, 52–59, doi: 10.1016/j.brainres.2009.05.001 (2009). [DOI] [PubMed] [Google Scholar]
- 40.Brenchat A. et al. 5-HT7 receptor activation inhibits mechanical hypersensitivity secondary to capsaicin sensitization in mice. Pain 141, 239–247, doi: 10.1016/j.pain.2008.11.009 (2009). [DOI] [PubMed] [Google Scholar]
- 41.Le Bars D, Dickenson AH & Besson JM Diffuse noxious inhibitory controls (DNIC). II. Lack of effect on non-convergent neurones, supraspinal involvement and theoretical implications. Pain 6, 305–327, doi: 10.1016/0304-3959(79)90050-2 (1979). [DOI] [PubMed] [Google Scholar]
- 42.Le Bars D, Dickenson AH & Besson JM Diffuse noxious inhibitory controls (DNIC). I. Effects on dorsal horn convergent neurones in the rat. Pain 6, 283–304, doi: 10.1016/0304-3959(79)90049-6 (1979). [DOI] [PubMed] [Google Scholar]
- 43.Le Bars D. The whole body receptive field of dorsal horn multireceptive neurones. Brain Res Brain Res Rev 40, 29–44, doi: 10.1016/s0165-0173(02)00186-8 (2002). [DOI] [PubMed] [Google Scholar]
- 44.Gebhart GF, Sandkuhler J, Thalhammer JG & Zimmermann M Inhibition of spinal nociceptive information by stimulation in midbrain of the cat is blocked by lidocaine microinjected in nucleus raphe magnus and medullary reticular formation. J Neurophysiol 50, 1446–1459, doi: 10.1152/jn.1983.50.6.1446 (1983). [DOI] [PubMed] [Google Scholar]
- 45.Francois A. et al. A Brainstem-Spinal Cord Inhibitory Circuit for Mechanical Pain Modulation by GABA and Enkephalins. Neuron 93, 822–839 e826, doi: 10.1016/j.neuron.2017.01.008 (2017). [DOI] [PMC free article] [PubMed] [Google Scholar]
- 46.Zhang Y. et al. Identifying local and descending inputs for primary sensory neurons. J Clin Invest 125, 3782–3794, doi: 10.1172/JCI81156 (2015). [DOI] [PMC free article] [PubMed] [Google Scholar]
- 47.Samineni VK et al. Divergent Modulation of Nociception by Glutamatergic and GABAergic Neuronal Subpopulations in the Periaqueductal Gray. eNeuro 4, doi: 10.1523/ENEURO.0129-16.2017 (2017). [DOI] [PMC free article] [PubMed] [Google Scholar]
- 48.Scherrer G. et al. Dissociation of the opioid receptor mechanisms that control mechanical and heat pain. Cell 137, 1148–1159, doi:S0092-8674(09)00444-9 [pii] 10.1016/j.cell.2009.04.019 (2009). [DOI] [PMC free article] [PubMed] [Google Scholar]
- 49.Cavanaugh DJ et al. Distinct subsets of unmyelinated primary sensory fibers mediate behavioral responses to noxious thermal and mechanical stimuli. Proc Natl Acad Sci U S A 106, 9075–9080, doi:0901507106 [pii] 10.1073/pnas.0901507106 (2009). [DOI] [PMC free article] [PubMed] [Google Scholar]
- 50.Mishra SK, Tisel SM, Orestes P, Bhangoo SK & Hoon MA TRPV1-lineage neurons are required for thermal sensation. EMBO J 30, 582–593, doi:emboj2010325 [pii] 10.1038/emboj.2010.325 (2011). [DOI] [PMC free article] [PubMed] [Google Scholar]
- 51.Cui L. et al. Identification of Early RET+ Deep Dorsal Spinal Cord Interneurons in Gating Pain. Neuron 91, 1413, doi: 10.1016/j.neuron.2016.09.010 (2016). [DOI] [PubMed] [Google Scholar]
- 52.Peirs C. et al. Dorsal Horn Circuits for Persistent Mechanical Pain. Neuron 87, 797–812, doi: 10.1016/j.neuron.2015.07.029 (2015). [DOI] [PMC free article] [PubMed] [Google Scholar]
- 53.Petitjean H. et al. Dorsal Horn Parvalbumin Neurons Are Gate-Keepers of Touch-Evoked Pain after Nerve Injury. Cell Rep 13, 1246–1257, doi: 10.1016/j.celrep.2015.09.080 (2015). [DOI] [PMC free article] [PubMed] [Google Scholar]
- 54.Duan B. et al. Identification of spinal circuits transmitting and gating mechanical pain. Cell 159, 1417–1432, doi: 10.1016/j.cell.2014.11.003 (2014). [DOI] [PMC free article] [PubMed] [Google Scholar]
- 55.Bannister K & Dickenson AH What the brain tells the spinal cord. Pain 157, 2148–2151, doi: 10.1097/j.pain.0000000000000568 (2016). [DOI] [PubMed] [Google Scholar]
- 56.Bannister K, Patel R, Goncalves L, Townson L & Dickenson AH Diffuse noxious inhibitory controls and nerve injury: restoring an imbalance between descending monoamine inhibitions and facilitations. Pain 156, 1803–1811, doi: 10.1097/j.pain.0000000000000240 (2015). [DOI] [PubMed] [Google Scholar]
- 57.Fields HL & Heinricher MM Brainstem modulation of nociceptor-driven withdrawal reflexes. Ann N Y Acad Sci 563, 34–44, doi: 10.1111/j.1749-6632.1989.tb42188.x (1989). [DOI] [PubMed] [Google Scholar]
- 58.Bunemann M, Bucheler MM, Philipp M, Lohse MJ & Hein L Activation and deactivation kinetics of alpha 2A- and alpha 2C-adrenergic receptor-activated G protein-activated inwardly rectifying K+ channel currents. J Biol Chem 276, 47512–47517, doi: 10.1074/jbc.M108652200 (2001). [DOI] [PubMed] [Google Scholar]
Methods only References
- 59.Klapoetke NC et al. Independent optical excitation of distinct neural populations. Nat Methods 11, 338–346, doi: 10.1038/nmeth.2836 (2014). [DOI] [PMC free article] [PubMed] [Google Scholar]
- 60.Brenner DS, Golden JP & Gereau R. W. t. A novel behavioral assay for measuring cold sensation in mice. PLoS One 7, e39765, doi: 10.1371/journal.pone.0039765 PONE-D-12-12943 [pii] (2012). [DOI] [PMC free article] [PubMed] [Google Scholar]
- 61.Fischer KB, Collins HK & Callaway EM Sources of off-target expression from recombinase-dependent AAV vectors and mitigation with cross-over insensitive ATG-out vectors. Proc Natl Acad Sci U S A, doi: 10.1073/pnas.1915974116 (2019). [DOI] [PMC free article] [PubMed] [Google Scholar]
Associated Data
This section collects any data citations, data availability statements, or supplementary materials included in this article.
Data Availability Statement
All data in this manuscript has been deposited as open source database, doi:10.5061/dryad.kkwh70s82.


