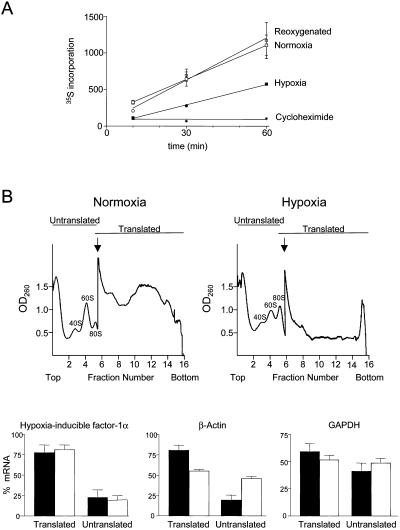
Figure 2.
Effect of hypoxia on protein synthesis. (A) Time course of incorporation of 35S-methionine/cysteine into TCA-precipitable protein. Cells were preincubated for 24 h under normoxia or hypoxia (1% O2) or incubated for 23 h under hypoxia, followed by 1 h of normoxia. Also shown is the incorporation into normoxic cells in the presence of 10 μg/ml cycloheximide. Each measurement was normalized with respect to total protein as determined by Bradford assay. (B) Effect of hypoxia on the translation of HIF-1α, β-actin, and GAPDH mRNAs determined by polysome profile analysis. NIH3T3 cells were incubated for 24 h in normoxia or hypoxia (1% O2), and cytoplasmic extracts were fractionated by 15–50% sucrose gradient centrifugation. Examples of polysome profiles showing the location of 80S ribosomes and free ribosome subunits are shown. The arrow indicates where the sensitivity of the UV monitor was increased fivefold. Transcripts that were being translated at the time of extract preparation are polysome-associated and sediment in fractions 7–16, with the most actively translated transcripts toward the bottom of the gradient. Cytoplasmic extracts from cells grown under normoxic or hypoxic conditions were fractionated, RNA was prepared from each fraction, and the HIF-1α, β-actin, and GAPDH mRNAs were detected by RNase protection assay. Each mRNA from the RNase protection assay was quantitated by phosphorimager and calculated as a percentage of the total for that mRNA. Data for fractions 1–6 and 7–16 were pooled and represented as translated or untranslated regions of the gradient, respectively. Black bars show data for normoxic cells, and white bars show data for hypoxic cells. The data represent the mean (±SEM) from three independent experiments.

