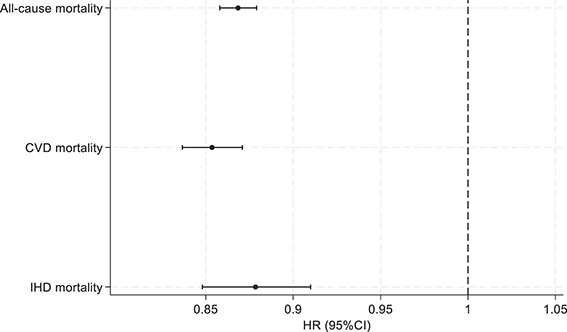
Figure 2.

Association between baseline heel BMD and mortality events (n = 399 297). Footnote: Estimates are from model 3 adjusted for age, sex, diabetes, hypertension, high cholesterol, smoking status, BMI, alcohol intake frequency, physical activity, Townsend score, educational level and BMI. The x-axis represents the hazard ratios (HR) obtained with Cox proportional hazard model. The y-axis lists mortality events.
