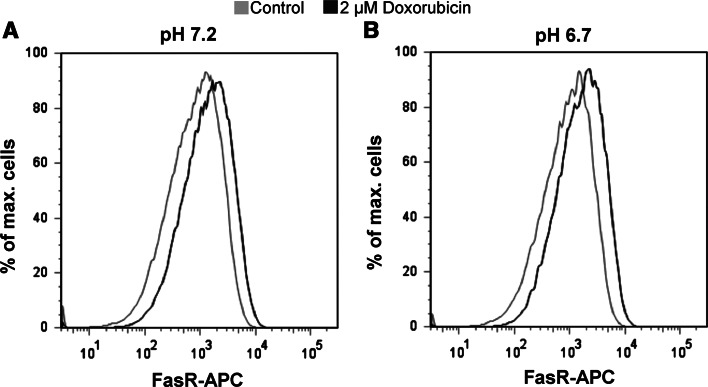
Fig. 4.
Up-regulation of FasR expression by doxorubicin in AGS cells. a The left panel shows the histogram of FasR-APC of the cells processed at the pH 7.2. The cells which were treated with the doxorubicin for 3 h (black curve) show clearly more cells which were APC positive as compared to the control cells (grey curve). b Similar results were obtained when cells were processed at the acidic pH (pH 6.7)

