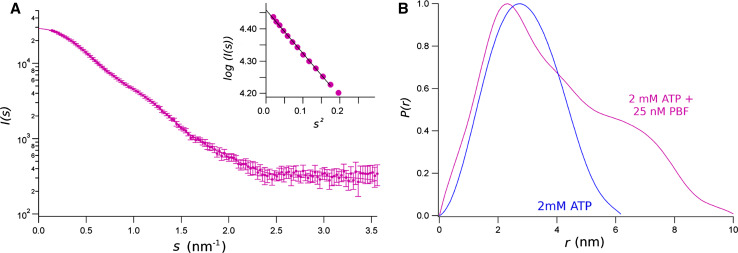
Fig. 6.
SAXS data from an equimolar mixture of CFTR NBD1/NBD2 in presence of 2 mM ATP and 25 nM PBF. a Data represent the intensity as a function of the momentum transfer, s. Bars standard deviations. The solid line is the reciprocal space fit of scattering computed for final P(r) function to data. The insets are the Gunier plots [I(s) versus s 2], where solid line is the extrapolation of data to s = 0, for sR g < 1.3. by the Guinier approximation. b Distance distribution function, P(r), calculated from SAXS experimental data for the mixture of NBD1/NBD2 in presence of 2 mM ATP, and with 25 nM PBF (magenta) and without the potentiator (blue). P(r) were normalised by their maximum for better comparison

