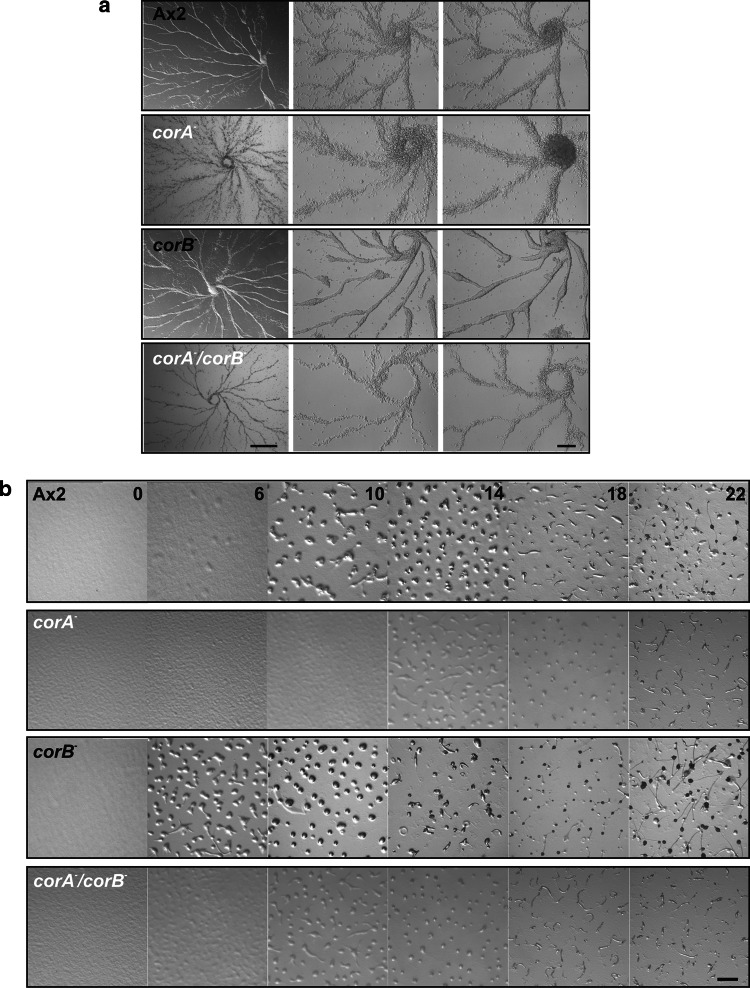
Fig. 6.
Coronin mutants show changes in developmental timing. a Stream formation under submerged conditions on a plastic surface. 2 × 10⁵ cells/cm2 were starved under Sorensen phosphate buffer on plastic plates and monitored for aggregation. Representative images were taken at 2.5× (left) and 10× magnification (both panels at the right). Bar 1 cm and 200 μm. b Development on non nutrient agar. For developmental analysis ~5 × 10⁷ cells were deposited on a phosphate agar plate (10 cm in diameter). Development was recorded by video imaging over 24–30 h after onset of starvation. Representative pictures are shown. Bar 1 mm

