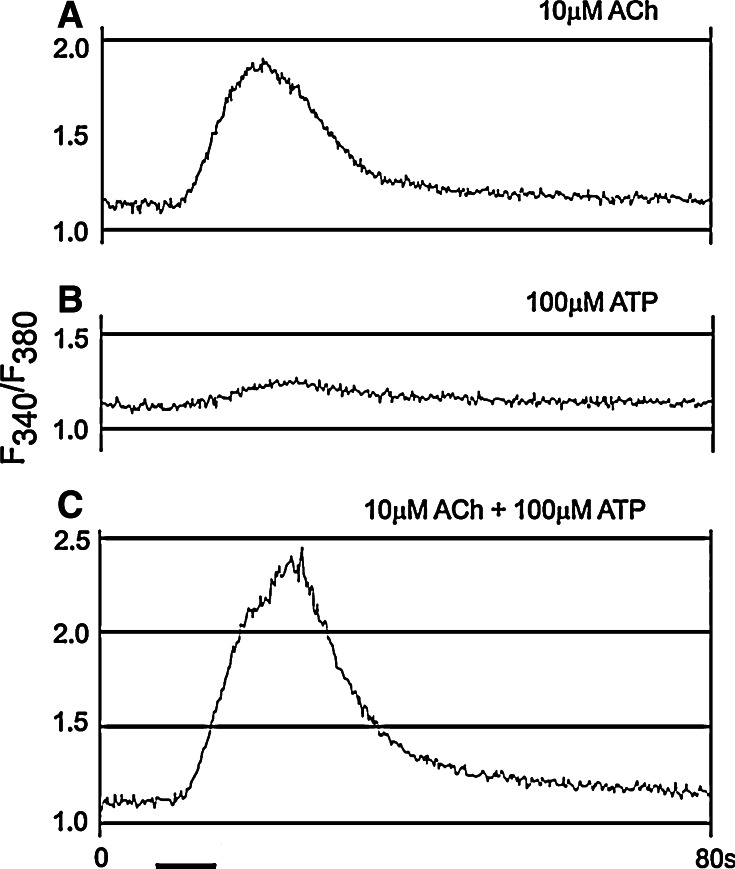
Fig. 1.
Interaction between acetylcholine (ACh) and ATP recorded in an otocyst from chick embryo. a The response to 10 μM acetylcholine. b The response to 100 μM ATP. c The response to the co-application of 10 μM acetylcholine and 100 μM ATP. The records in a–c were taken in this order at 5-min intervals. The bath solutions contained 25 mM Ca2+ (reproduced form [26] with permission from John Wiley and Sons Ltd.)

