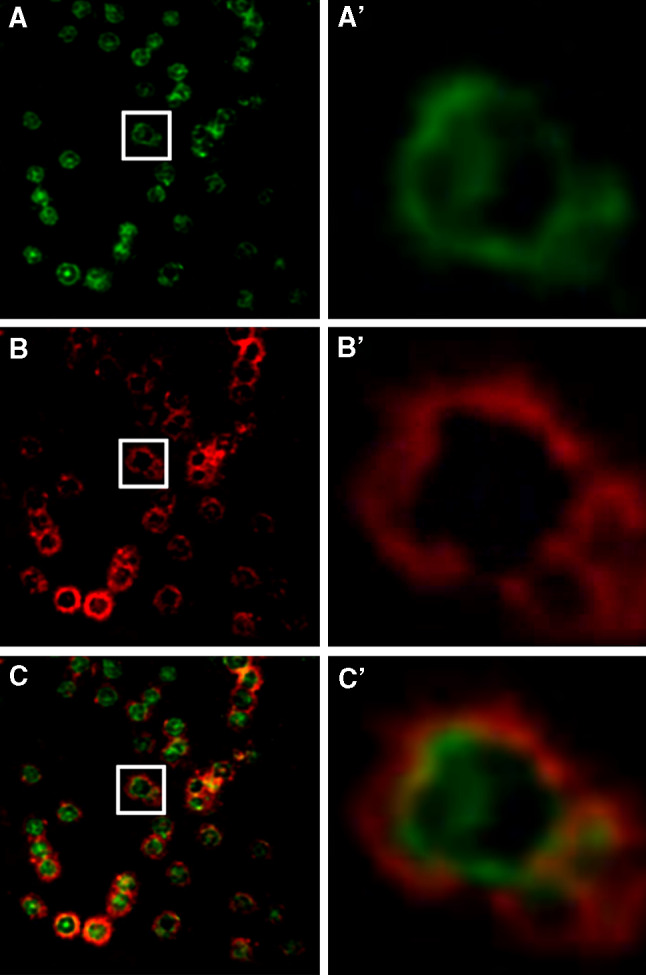
Fig. 3.

Subcellular distribution of tubulin in human erythrocytes. Human erythrocytes were fixed on coverslips and analyzed by confocal immunofluorescence microscopy using mouse mAb DM1A for α-tubulin (green, a) and rabbit polyclonal antibody H-300 for α-subunit of Na+, K+-ATPase (red, b), as described in “Materials and methods.” c, merge. a′, b′ and c′: Enlargement of the area indicated by white rectangle in a, b and c, respectively
