Fig. 13.
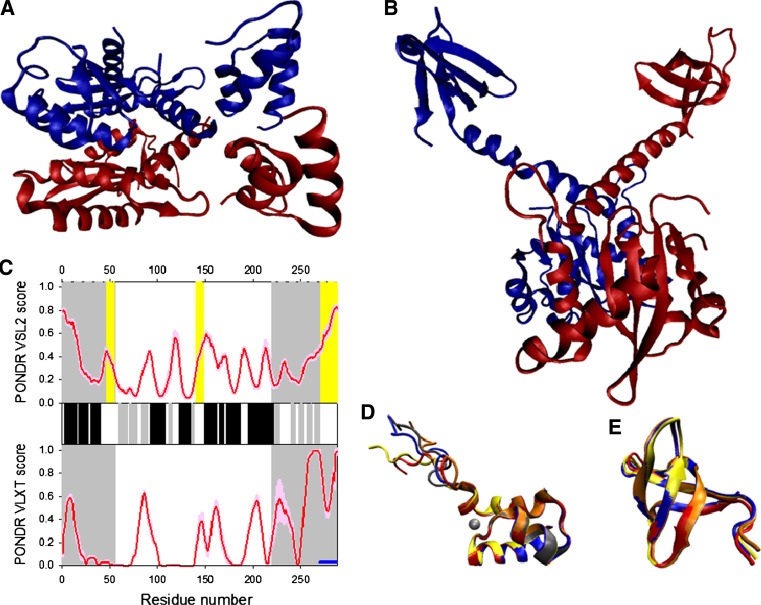
Disorder propensity and structural features of the HIV-1 integrase. a Crystal structure of the dimer of a fragment of HIV-1 integrase comprising the N-terminal and catalytic core domains (1K6Y). b Crystal structure of the dimer of a fragment of HIV-1 integrase comprising the catalytic core and C-terminal dimerization domains (1EX4). c Disorder predisposition of IN evaluated by PONDR® VSL2 (top panel) and PONDR® VLXT (bottom panel). Red line represents an averaged disorder score for IN from ~50 different HIV-1 isolates. Pink shadow covers the distribution of disorder scores calculated for IN from these isolates. Locations of β-strands and α-helices seen in the crystal structure are indicated by gray and black bars between the panels with the disorder scores. Gray shaded areas correspond to the N-terminal and C-terminal domains of IN. Yellow shaded areas represent location of regions 47–55, 140–148, and 271–288, which are flexible in the integrase crustal structures. d NMR solution structure of the N-terminal domain of intergrase (1WJD). Five representative members of the conformational ensemble are shown by structures of different color. e NMR solution structure of the C-terminal domain of intergrase (1IHW). Four representative members of the conformational ensemble are shown by ribbons of different color

