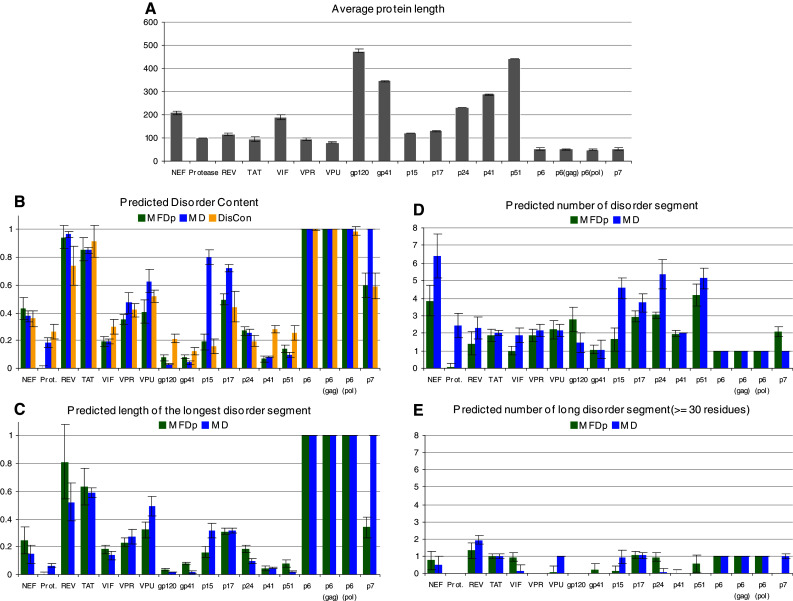
Fig. 2.

a Length distribution of various members of the HIV-1 proteome. The error bars denote the corresponding standard deviations. b The average (across different isolates of the virus for the same protein) disorder content computed with MFDp, MD, and DisCon predictors. The error bars denote the corresponding standard deviations. c The average (across different isolates of the virus for the same protein) normalized, by the chain length, length of the longest disordered segment generated with MFDp and MD. The error bars denote the corresponding standard deviations. d The average (across different isolates of the virus for the same protein) number of the disordered segments computed with MFDp and MD predictors. We count only the segments that include at least four residues. The error bars denote the corresponding standard deviations. e The average (across different isolates of the virus for the same protein) number of long, with at least 30 residues, disordered segments computed with MFDp and MD predictors. The error bars denote the corresponding standard deviations
