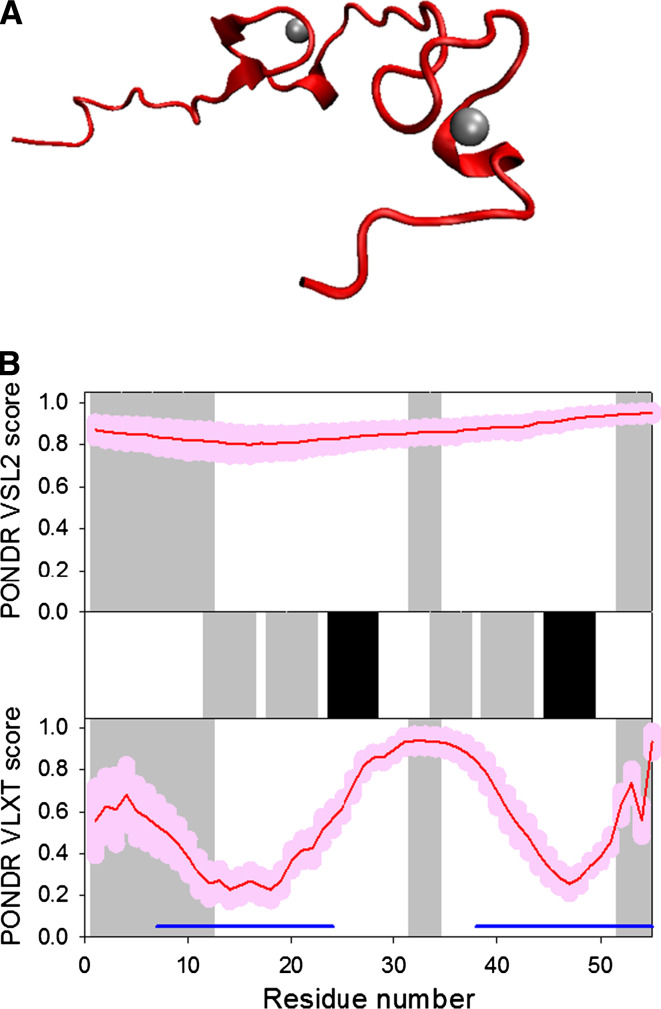
Fig. 9.
Disorder propensity and structural features of the HIV-1 nucleocapsid protein p7. a Solution NMR structure of HIV-1 p7 (1MFS). b Disorder prediction evaluated by PONDR® VSL2 (top panel) and PONDR® VLXT (bottom panel) for the HIV-1 p7 protein. Red line represents an averaged disorder score for p7 from ~50 different HIV-1 isolates. Pink shadow covers the distribution of disorder scores calculated for p7 from these isolates. Locations of α-helices and β-strand seen in the crystal structure are indicated by the black and gray bars, respectively, shown between the panels with the disorder scores. Gray shaded areas correspond to the dynamic 1–13, 32–34, and 52–55 regions of p17. Dark blue lines represent predicted α-MoRFs

