
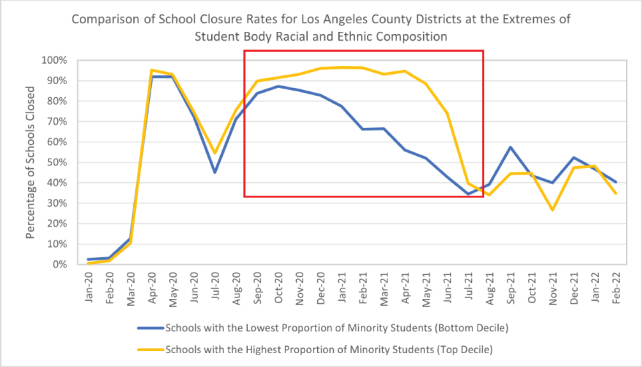
FIGURE 1. Average Monthly School Closure Rates for Los Angeles County Public Schools by Race and Ethnicity.
SOURCE: Los Angeles Almanac. 2020. Ethnic distribution of pupils by school districts: Los Angeles County: School year 2019–2020. Available at: http://www.laalmanac.com/education/ed05.php (accessed January 13, 2023).
NOTE: Each series comprises the 10 percent of school districts with the highest and lowest proportions of minority students. The red box highlights a stark difference in school closures between the two groups during the 2020–2021 academic year.
Figure 1 was developed with data from the California Department of Education via the Los Angeles Almanac (2020) and depicts the disparity between closure rates for schools in Los Angeles County, represented by the proportion of a district’s ethnic minority students. Schools were considered closed if the district saw a greater than 50 percent decline in foot traffic in 2020 over the same month in 2019, when schools were still open, according to the US School Closure and Distance Learning Database’s use of anonymized mobile phone location data (Parolin and Lee, 2021).
School student counts and ethnic compositions are as reported for the 2019–2020 school year by the California Department of Education via the Los Angeles Almanac (2020). Proportions are averaged across all the districts selected. The lowest percent minority district set includes the 10 percent of Los Angeles County districts with the highest proportion of non-minority students (n = 8; all more than 45 percent White). This set covers about 115 schools educating over 87,000 students (about 5.9 percent of the Los Angeles County total). No closure data were available for one small district (Hermosa Beach City; 1,378 students; 67.5 percent White) and one independent school (Hughes-Elizabeth Lakes Union Elementary; 196 students; 64.8 percent White). They were excluded and replaced by two districts further down the scale.
The highest percent minority district set includes the 10 percent of Los Angeles County districts with the largest proportion of minority students (n = 9; though two separate parts of one district were tracked separately: all more than 98 percent minority). This set covers about 125 schools educating over 93,000 students (about 6.3 percent of the Los Angeles County total). Of note, closure data for Lennox School District (13,818 students; 0.7 percent White) were unavailable for the first half of 2021. It is not included in the averaged value on the graph for those months.
A similar analysis (data not shown) was conducted for the top and bottom quartiles (instead of decile) and showed a similar, though less pronounced, difference between the two series. Chartered public schools were excluded from this analysis.