
Fig. 1. Multimeric preassembly of ligand-free EphA2 detected by PIE-FCCS measurements.
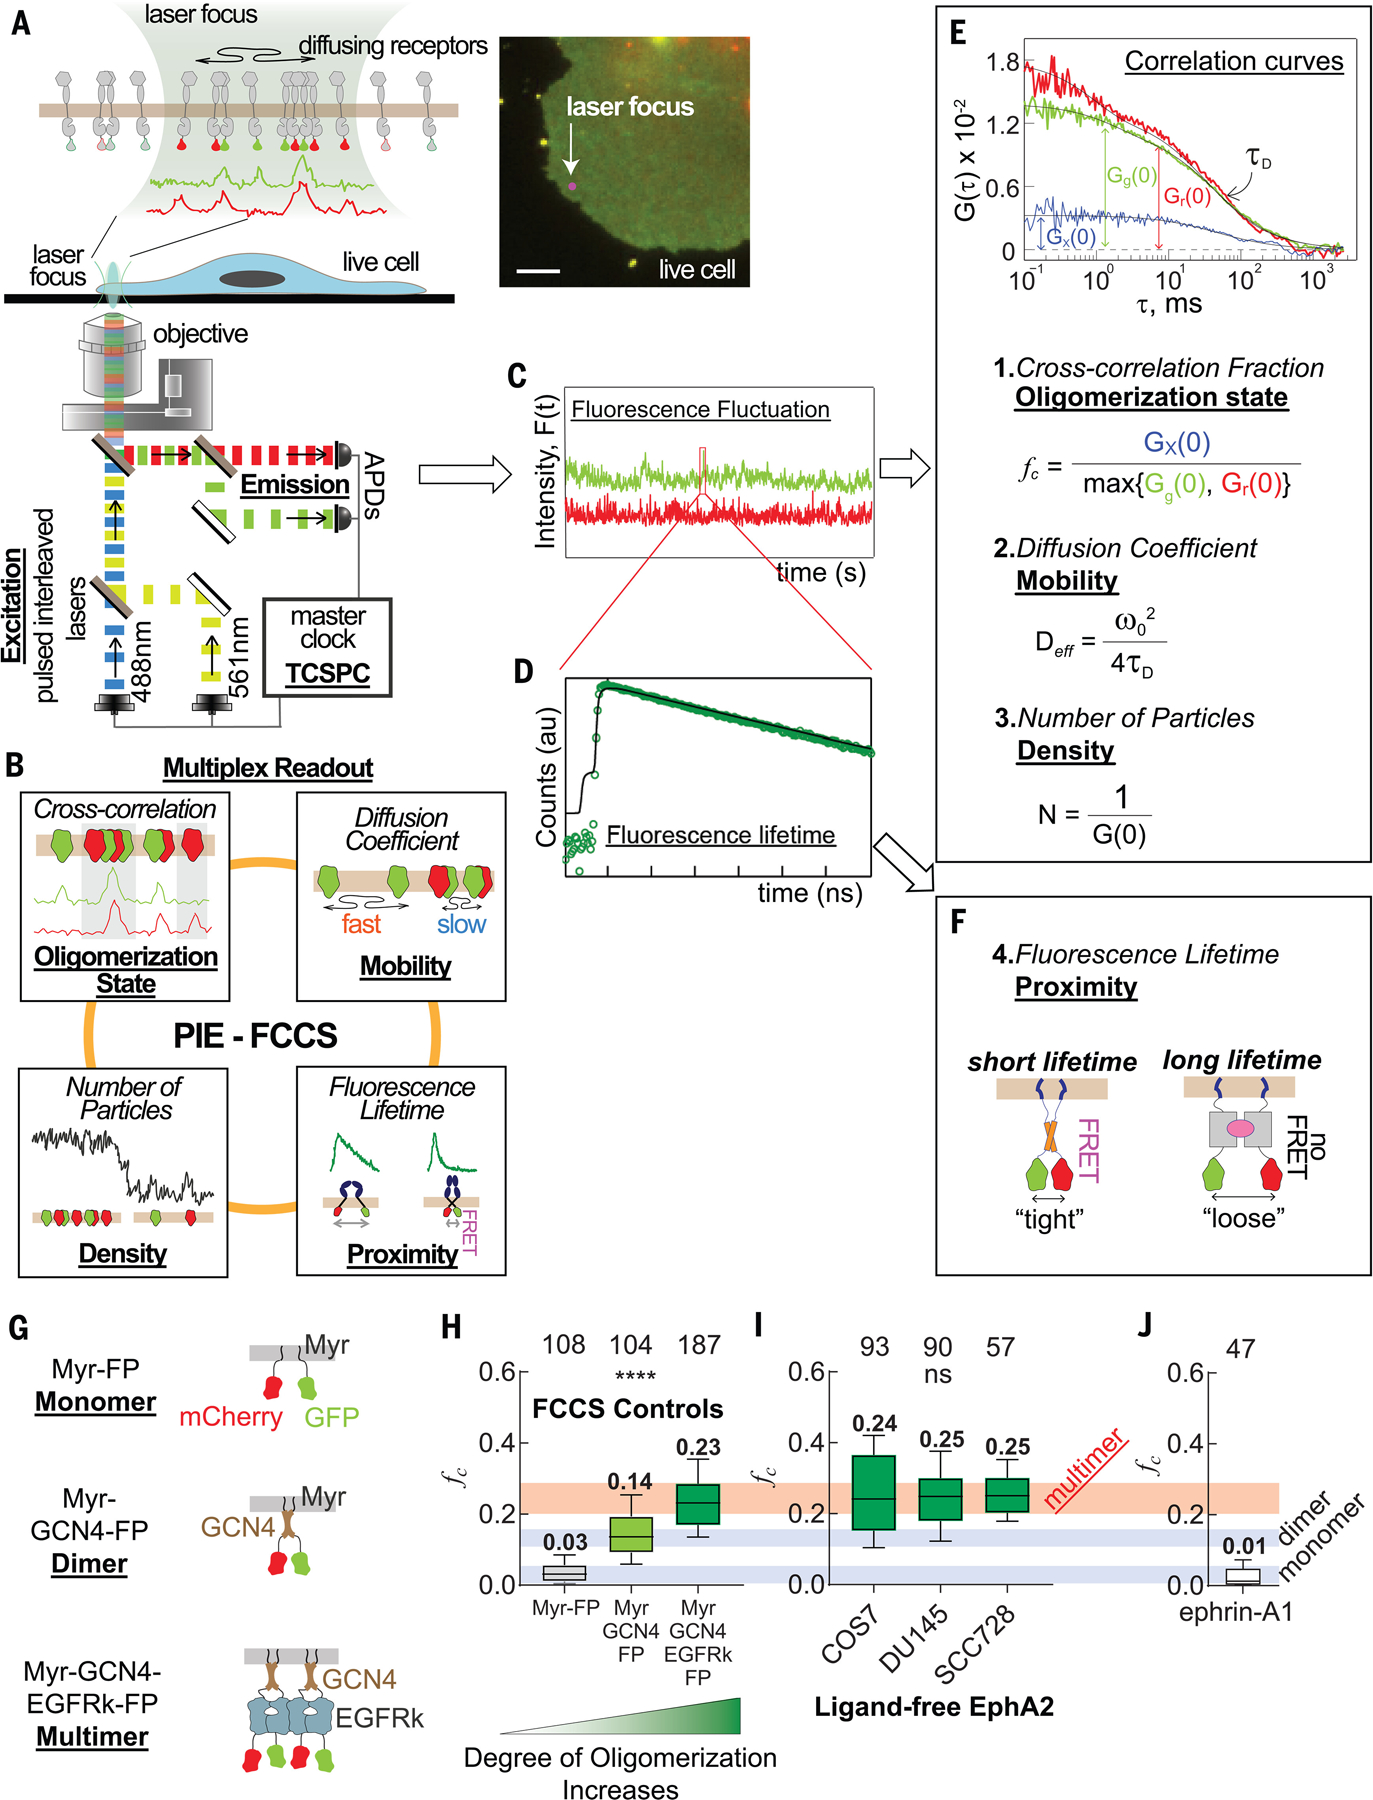
(A) Schematic of the two-color PIE-FCCS instrument. Two pulsed lasers are focused on the peripheral membrane of a live COS7 cell (inset, epifluorescent image) that expresed GFP- or mCherry-tagged membrane receptors. Scale bar is 5 μm. APDs, avalanche photondiode detectors; TCSPC, time-correlated single photon counting. (B) Diagram of multiplexed readout of molecular dynamics of receptors in cell membranes from PIE-FCCS measurements. (C and D) Raw data, including fluorescence fluctuation signals (C) and decay of fluorescence lifetime of GFP (D), that were collected during PIE-FCCS measurements. au, arbitrary units; F(t), fluorescence signal at time t. (E) Autocorrelation (green and red) and cross-correlation (blue) functions of the fluorescence fluctuation signals, and three parameters obtained from the curves. Deff, effective diffusion coefficient; G(τ), normalized autocorrelation function of the fluorescence fluctuation; Gx, cross-correlation function; Gr, autocorrelation function of mCherry; Gg, autocorrelation function of GFP; τD, the lateral diffusion time within the confocal volume; ω, radius of the confocal volume. (F) Diagram of the fluorescence lifetime parameter, which indicates the C-terminal proximity within the protein oligomers. A shorter fluorescence lifetime of GFP is observed in oligomers with tight C-terminal assembly due to FRET. (G) Diagram of oligomerization control constructs. The monomeric control is a coexpression of fluorescent protein (FP, either GFP or mCherry), each fused separately to a c-Src membrane localization sequence (Myr-FP). The dimeric control has the leucine-zipper dimerization motif of GCN4 fused to GFP or mCherry and the c-Src membrane localization sequence (Myr-GCN4-FP). The multimeric control has the self-dimerizing kinase domain of EGFR introduced after the GCN4 motif (Myr-GCN4-EGFRk-FP). (H) Single-cell fc values for each of the control constructs taken concurrently with the EphA2 data. (I) Single-cell fc values of ligand-free EphA2 in the plasma membranes of three cell lines: COS7, DU145, and SCC728. The fc distributions from each cell line are similar to that of the multimer control, as indicated by the red horizontal bar. (J) Single-cell fc values of ephrin-A1 in the plasma membranes of COS7, which is close to zero, suggesting that ephrinA1 is mostly monomeric. In (H) to (J), the boxes represent third quartile, median, and first quartile, and the whiskers indicate the 10th to 90th percentile. The total cell number that was used for each sample is reported at the top of the box plots. Data were analyzed by one-way analysis of variance (ANOVA) test; ****p < 0.0001, and ns is not significant.