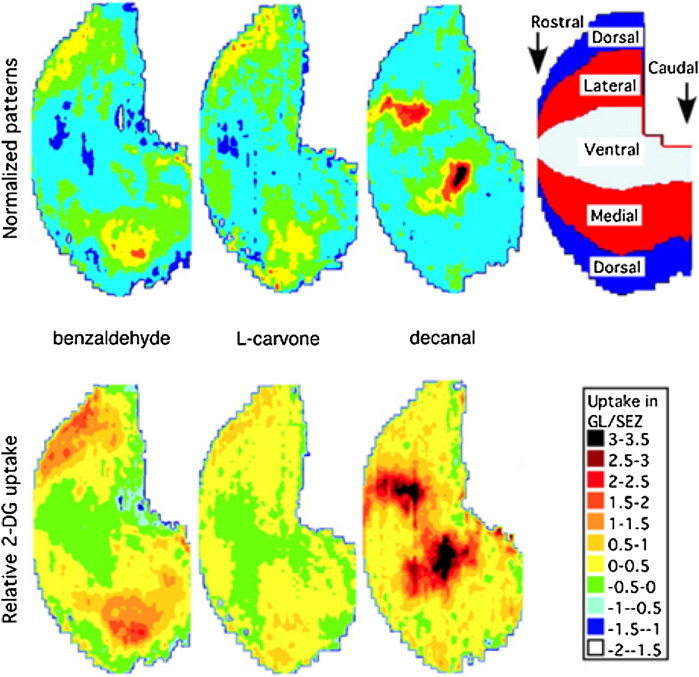
Fig. 2.
Mapping of 2DG uptake during sustained MOB activation. Top left: Normalized z-score flattened patterns of the whole bulb in a ventral-centered representation for three odorants in groups of 3-week-old rats (n = 10). Top right: Topographic explanation of the flattened map (details of the method in reference [23]). Bottom: Reconstructed relative glucose uptake maps. GL/SEZ glomerular layer/subependymal zone (area with no specific uptake). (Adapted from reference [30] with permission from Oxford University Press)

