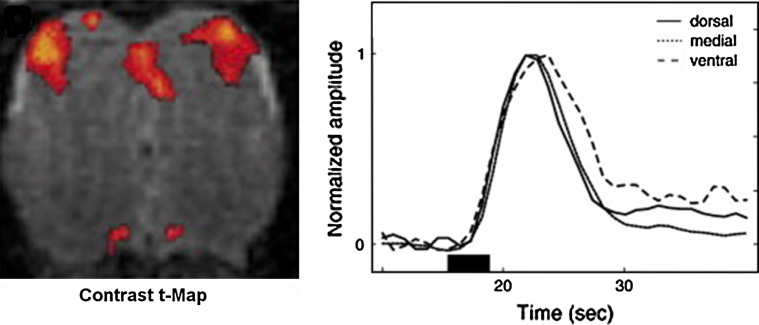
Fig. 3.
Mapping of MOB activation using BOLD-fMRI. Left: Coronal BOLD image through a rat MOB. Significant odor-activated zones are represented in red. Right: Time-course of odor-induced BOLD signal changes showing delayed activation of the ventral region. (Reprinted from reference [42] with permission from Elsevier; copyright 2007))

