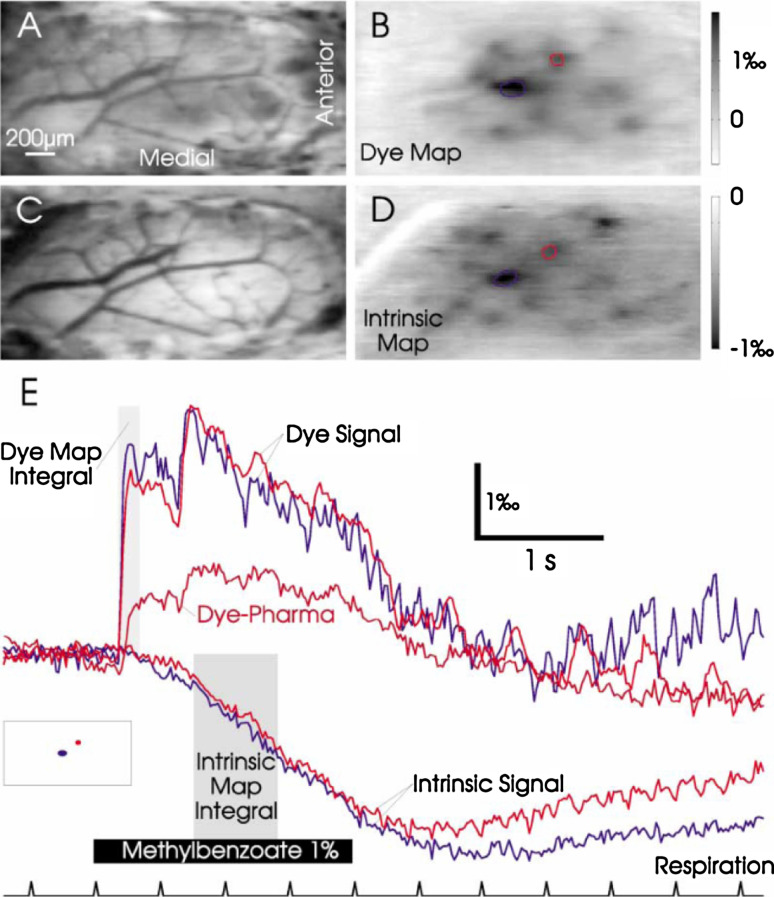
Fig. 5.
VSD imaging resolves glomerular activation with high temporal and spatial resolution. a Blood vessel pattern visualized in VSD-loaded dorsal MOB tissues illuminated at 540 nm. b VSD map evoked by presentation of 1% methylbenzoate. Frames were averaged during the period of the shaded square shown in e. The grayscale (clipping range) 0.08–0.18% is inverted for comparison with the intrinsic map shown in d. c Blood vessel pattern before intrinsic imaging. d IOS map evoked by the same odor. Frames were averaged during the period of the shaded square shown in e, grayscale 0.12–0%. Maps obtained using the two techniques are very similar although some of the caudal glomeruli did not appear in the VSD map presumably due to poor dye staining. e Reflectance and fluorescence changes plotted as a function of time for the red and the blue regions shown in inset and in b and d. The VSD signal is significantly faster and locked to inspirations after odor application. IOS peaks after a long delay and does not resolve the respiration-coupled activity. The decline in the VSD signal parallels the beginning of IOS during odor stimulation and may partly reflect contamination of the dye signal by intrinsic optical changes. The trace labeled “Dye-Pharma” shows the time-course for the region with the biggest remaining response after local application of the glutamate receptor antagonists (average of eight repetitions). (Reprinted from reference [72] with permission from Elsevier, copyright 2002)

