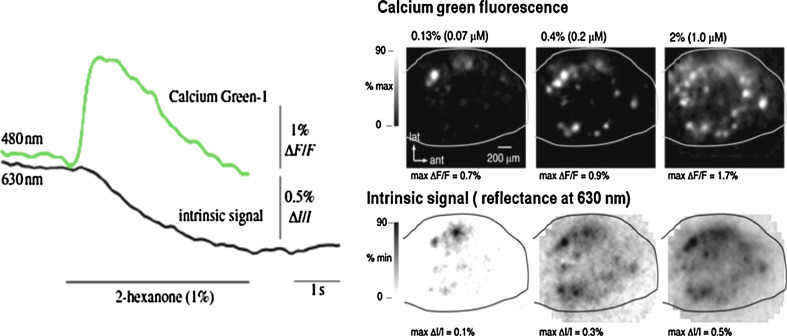
Fig. 6.
Comparison of calcium fluorescence maps at the presynaptic level and IOS maps acquired sequentially in the same mice. Left: Time-course and amplitude for each optical signal in a region of interest activated under odorant presentation. Right: Activation maps obtained sequentially in the same mice using calcium and intrinsic imaging for increasing stimulus intensities. (Adapted from reference [80], used with permission, copyright 2003))

