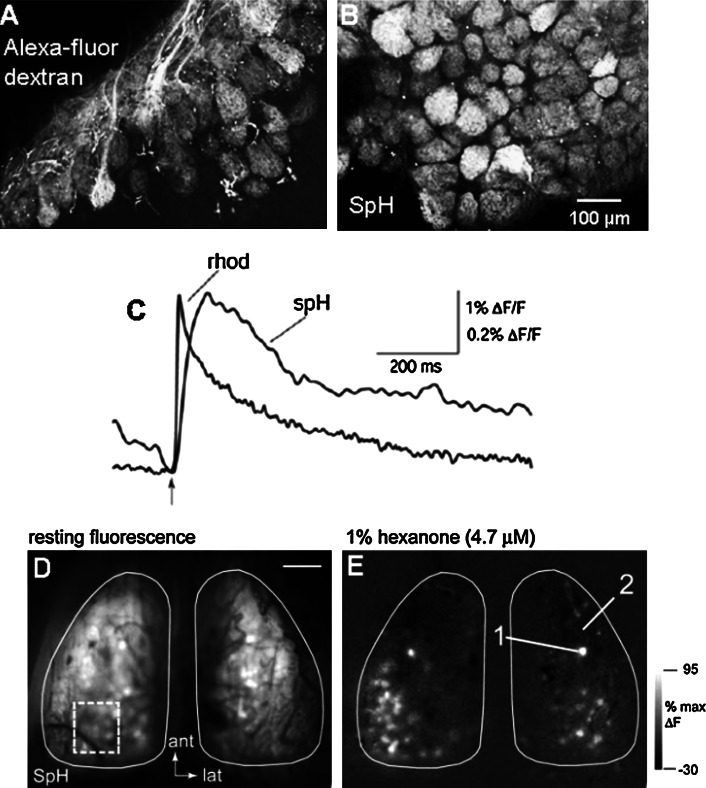
Fig. 7.
Presynaptic imaging of SpH for olfactory mapping. a, b Confocal microscopy images of the surface of MOB slices for comparison of fluorescence resulting from anterograde calcium labeling and SpH. Labeling of axon bundles in the ONL and GL are seen with Alexa Fluor dextran, whereas only glomeruli are labeled in SpH mice. For both labelings, no fluorescence is seen in the periglomerular area. c Comparison of the amplitude and time-course of calcium (high-affinity rhod tracer) and SpH signals recorded alternately in the same glomerulus. Both traces are from a single trial. The onsets of the signals are the same following stimulation, but the rise time of the rhod signal is much shorter than that of SpH (amplitude bar ∆F/F: SpH 1%, rhod 0.2%). d Resting fluorescence in SpH mice. e Activation maps induced by a 2-s presentation of 1% hexanone shows bilaterally symmetrical maps. (a–c Adapted from reference [88] used with permission; d, e reprinted from reference [87] with permission from Elsevier, copyright 2003)

