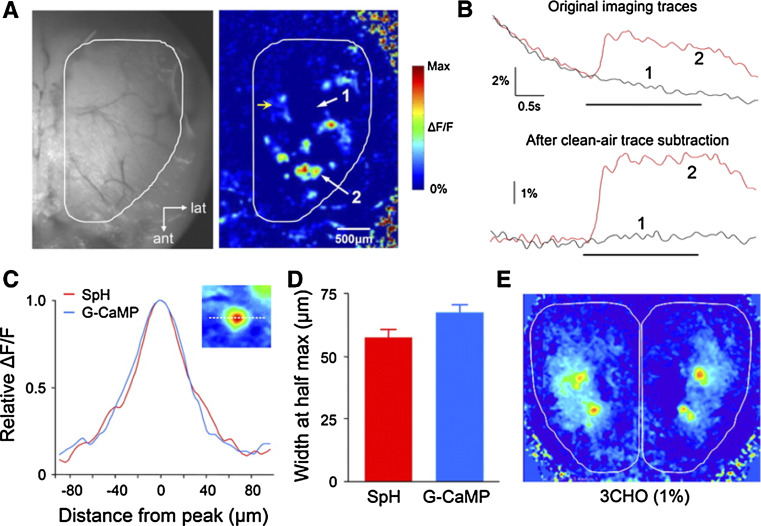
Fig. 8.
Odorant-evoked GCaMP2 calcium responses in the MOB. a Left: Resting fluorescence image of the MOB surface observed through the thinned skull of a GCaMP2 mouse. Right: A single-trial odor response map induced by butyraldehyde (0.25% of saturated vapor). Arrows indicate the locations where the odor-evoked response traces shown in b were obtained. b Top: Raw fluorescence traces without photobleaching correction. The red and gray traces are the GCaMP2 signals measured, respectively, in odor-activated (trace 2) and nonactivated regions (trace 1) as indicated in a. The black horizontal bar indicates a 2-s odor delivery. Bottom: Same odor responses with photobleaching subtraction using a no-odor imaging trial. c Comparison of the averaged ΔF/F response spatial profile in odor-evoked hot spots in the GCaMP2 mice (blue) and from SpH-labeled olfactory glomeruli in the OMP-SpH mice (red). d Quantitative comparison of the mean widths measured at half-maximum in the GCaMP2 and OMP-SpH mice. e Odor-evoked GCaMP2 response maps are bilaterally symmetrical (adapted from reference [98], used with permission)

