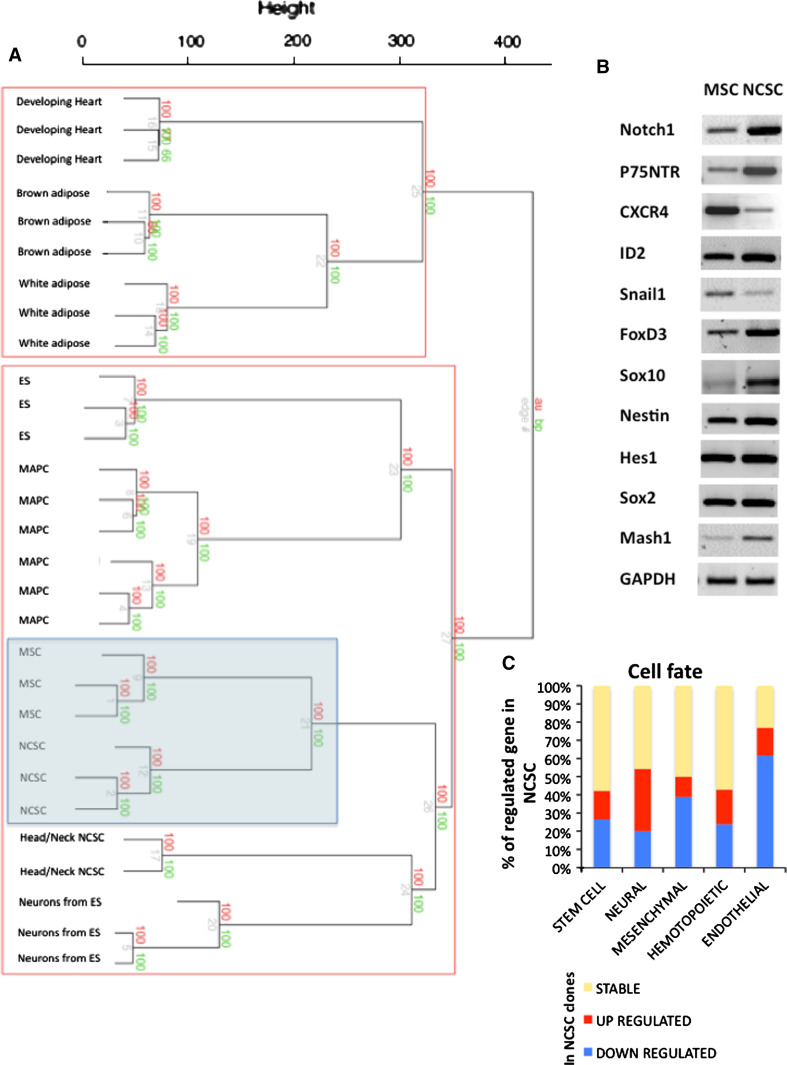
Fig. 5.
Microarray analyses of NCSC and MSC clones: Cell fate. a Dendrogram generated after agglomerative hierarchical clustering using Euclidean distance, average linkage and multiscale bootstrap resampling. 29 expression array data sets were included in an unsupervised analysis with hierarchical clustering of samples. Adipocytes (brown and white adipose, GSE8044); cardiomyocytes (GSE7196); ES and neural precursors from ES (GSE8024); MAPC (GSE6291); head and neck neural crest stem cells (GSE11149) are accessible on GEO datasets/NCBI (http://www.ncbi.nlm.nih.gov/gds). All replicates were merged under the same denomination when possible. The dendrogram was build with the Euclidean distance as dissimilarity metric and the average linkage method for definition of the structure. Values on the edges of the clustering are p values (%). Red values are AU p values, and green values are BP values. Approximately Unbiased (AU) p values were computed by multiscale bootstrap resampling. Bootstrap Probability (BP) values were computed by normal bootstrap resampling. R‐cran “pvclust” package was used for assessing the uncertainty of this hierarchical cluster analysis for 10,000 permutations of genes. Those values indicated how strongly the cluster was supported by the data. b Using semi-quantitative RT-PCR, we analyzed the expression of several genes known to be expressed in stem cells or neural crest cells (primers and PCR characteristics can be found in Glejzer et al. [9]). c Here, we report all genes from microarray analyses that were expressed by NCSC or MSC clones, and involved in cell fate decision. We classified those genes into five families: stem cell, neural, hematopoietic, mesenchymal and endothelial fate. Those results suggested that NCSC clones mainly expressed neural genes while MSC clones mainly expressed mesenchymal and endothelial genes. Genes that were equally expressed by both cell types are in yellow, over-expressed genes in NCSC are in red and down-expressed genes in these cells are in blue

