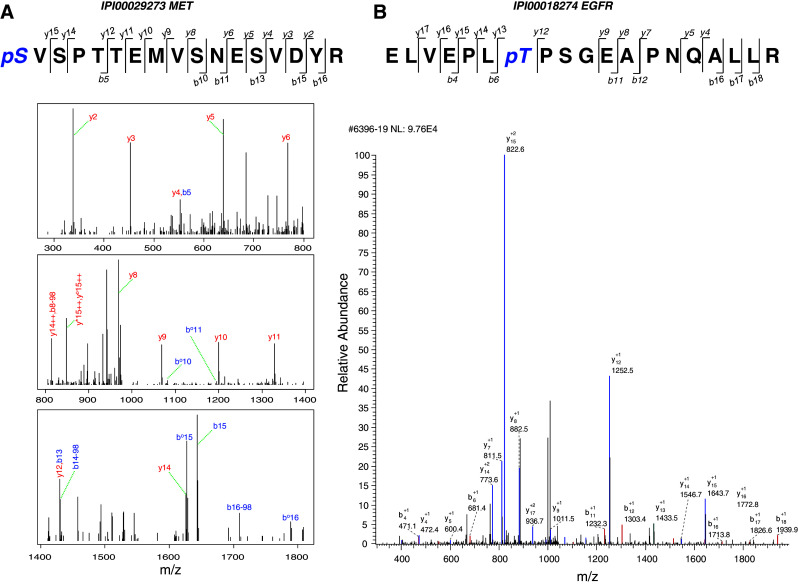
Fig. 1.

MS spectra interpreted by Mascot and Sequest. Annotated MS/MS spectra for peptides from a MET, identified via Mascot and b EGFR, identified via Sequest are shown. Spectrum annotated by Mascot is split into three parts according to mass range. Detected b ions and y ions are annotated
