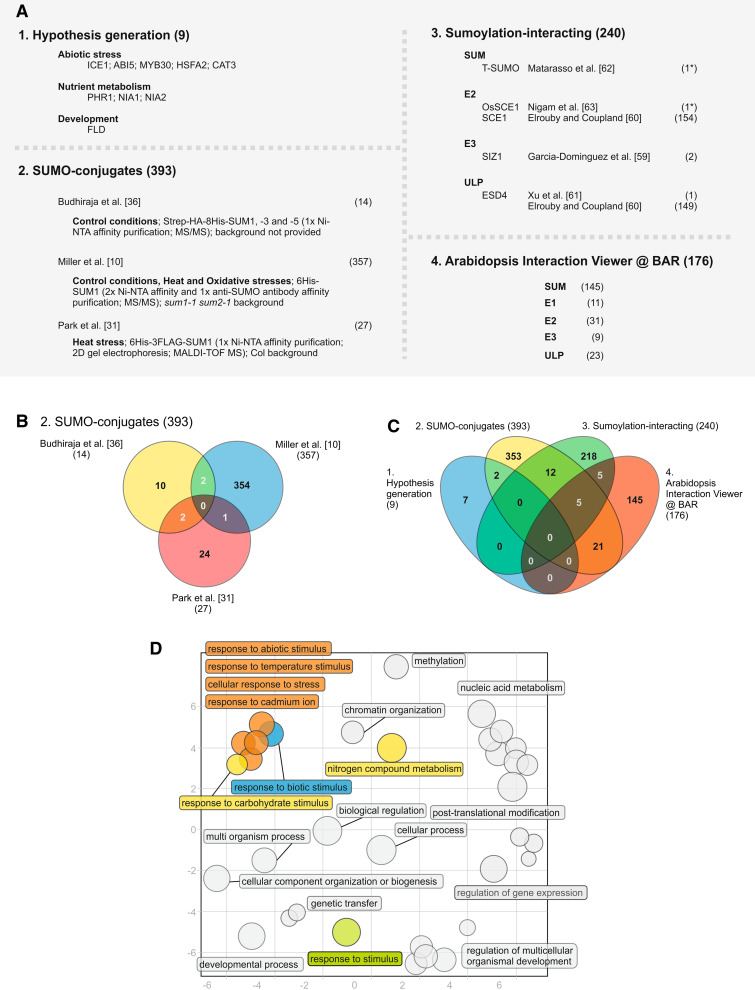
Fig. 2.
Annotation and characterization of the predicted plant SUMO targets. a The four major strategies adopted for identifying plant SUMO targets have rendered a total of 768 proteins. b Venn diagram analysis of the three existing SUMO-conjugate studies. c Venn diagram analysis of the four subsets of strategies used to identify SUMO targets. d Scatterplot of enriched gene ontology (GO) terms (biological process) for the subset of SUMO-conjugates. GO functional categorization was performed using VirtualPlant 1.2 software (http://virtualplant.bio.nyu.edu/cgi-bin/vpweb/), using the BioMaps function with a 0.01 p-value cutoff [102]. Exclusion of GO term redundancy and subsequent scatterplot analysis were performed using the REVIGO tool (http://revigo.irb.hr/), with a 0.5 C-value [65]. Bubble size indicates the frequency of the GO term, colored circles indicate GO terms related to stress or nutritional stimuli. The scatterplot represents the cluster representatives in a 2D space (x- and y-axis) derived by applying multidimensional scaling to a matrix of the GO terms’ semantic similarities [65]. # Number of genes within the subset, asterisk non-Arabidopsis genes, MALDI–TOF MS matrix-assisted laser desorption/ionization–time of flight mass spectrometry

