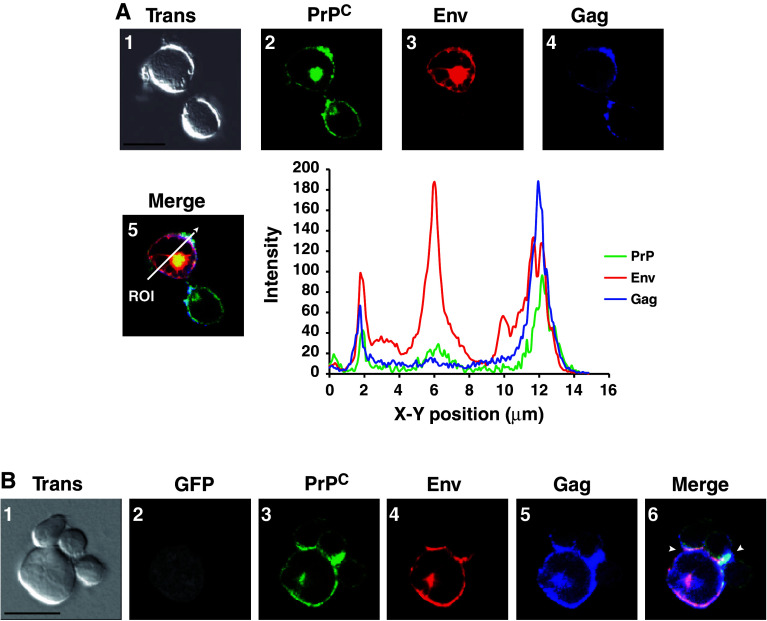
Fig. 5.
PrPC colocalizes with HIV-1 Gag and Env in infected T lymphocytes. a CEM cells infected with HIV-1 were recovered 5 days after infection, fixed and analyzed by confocal immunofluoresence using anti-PrP (panel 2, green), anti-Envgp120 (panel 3, red) and anti-MAp17 (panel 4, blue) antibodies. Images are single sections through the middle of the cell with the corresponding transmission image (panel 1): areas of green/red/blue colocalization appear white (panel 5). Region of interest (ROI; white arrow) is depicted in the merge panel (panel 5). The plot profile of PrPC (green)/Env (red) and Gag (blue) colocalization along the ROI was constructed and analyzed using Image J software. b HIV-1 infected CEM-GFP cells were put in contact with activated PBLs for 3 h at 37°C on SuperFrostRPlus microscope slides in an humidified chamber and then fixed. Images are single sections through the middle of the cell with the corresponding Nomarski image (panel 1). Confocal immunofluorescence was carried out using anti-PrP (panel 3, green), anti-Envgp120 (panel 4, red) and anti-MAp17 (panel 5, blue) antibodies. Panel 2 corresponds to GFP fluorescence (grey staining) indicating the HIV-1 CEM-GFP-positive cell. Areas of PrP (green)/Env (red)/Gag (blue) colocalization appear white (see arrowheads in merge, panel 6). Note the strong signal of PrPC at the virological synapse. Scale bars are 10 μm

