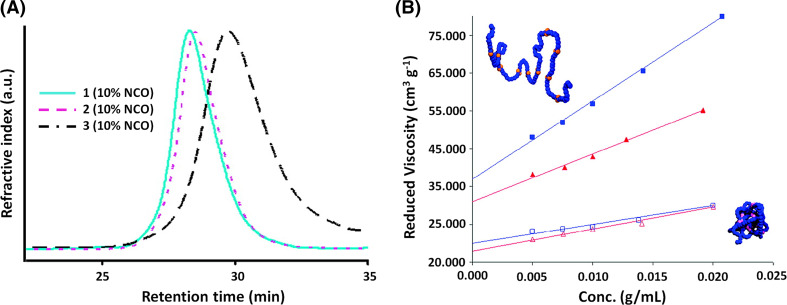
Fig. 2.
a Overlay of GPC traces for the starting copolymer 1, (Mn = 45,300), the corresponding linear control polymer 2 and NP 3 incorporating ca. 10 mol% isocyanate (NCO) cross-linking functional groups; b Plot of reduced viscosity versus concentration for control copolymers 2 (closed square 150 kDa; closed triangle 100 kDa) and their analogous cross-linked NPs 3 (open square 150 kDa; open triangle 100 kDa) in THF. Mol% NCO is 10 in this case. Reproduced and adapted from [38] with permission of ACS

