Fig. 4.
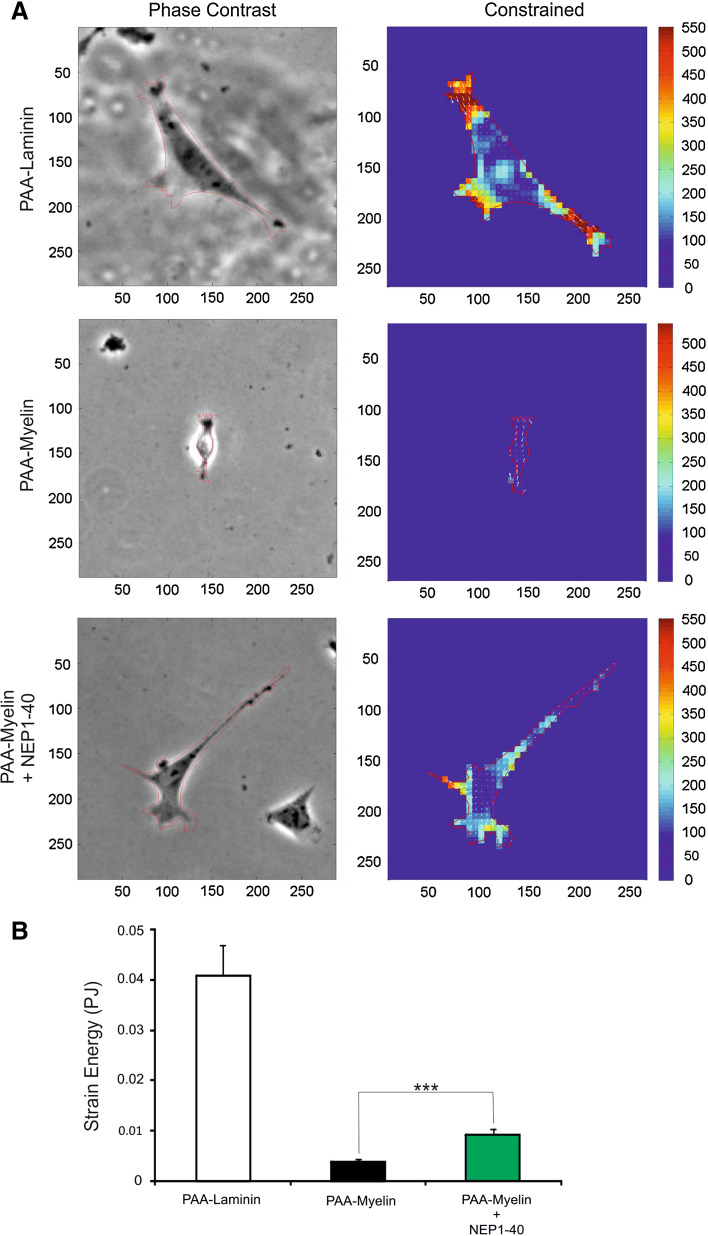
TFM analysis of cultured TEG3 cells. a Quantitation of cellular traction forces of cultured TEG3 cells in PAA-laminin, PAA-myelin, and PAA-myelin + NEP1-40. A phase-contrast image of examples of cultured cells is shown on the left side. The scale in μm is also displayed in the lower and the left side of each image. In addition, the force map of cultured cells is shown on the right column. Arrows indicate the direction of the bead displacement. The color scale indicates the magnitude of the cellular traction forces (measured in Pa). b Histogram illustrating the quantitative results of the TFM analysis. Data in b is represented as mean ± SEM of the TFM analysis of 61 cells (PAA-laminin), 83 cells (PAA-myelin) and 62 cells (PAA-myelin + NEP1-40). Asterisks in b indicate statistical differences (p < 0.05, ANOVA test)

