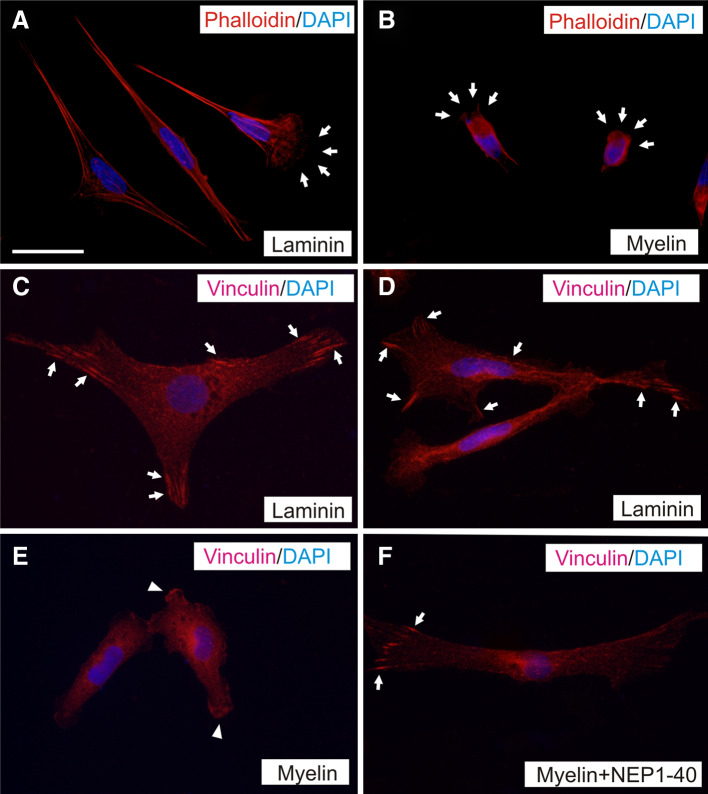
Fig. 5.
Changes in stress fibers and FA distribution in cultured TEG3 cells. a, b Photomicrographs illustrating the distribution of F-actin in cultured TEG3 cells growing on laminin (a) or myelin (b). Stress fibers are clearly identified in a and poorly defined in b. Arrows in a and b point to cellular protrusions. c–f Distribution of FA (arrows) in cultured TEG3 cells on laminin (c, d), myelin (e), and myelin + NEP1-40. Notice the loss of FA and the diffuse vinculin-staining in TEG3 cells cultured over myelin (arrowheads in e) and the recovery of the FA (vinculin-positive) after incubation with NEP1-40 (arrows in f). Scale bars: a = 20 μm pertains to b–f

