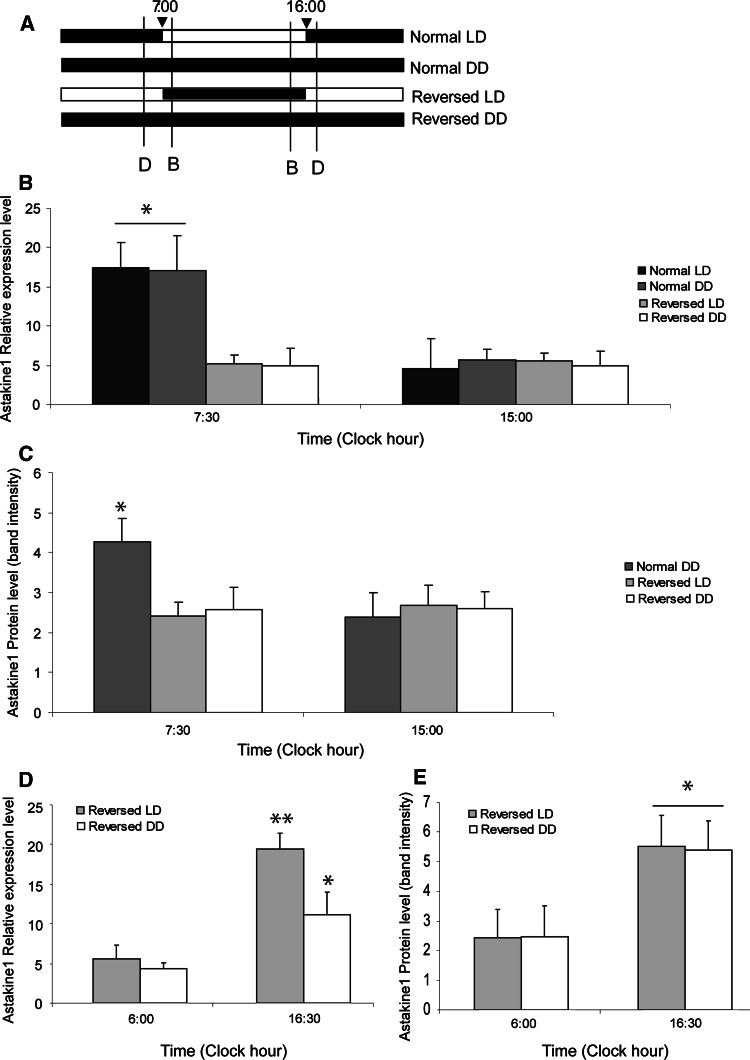
Fig. 5.
Astakine1 mRNA expression in hemocytes and protein levels in plasma at dusk and dawn during normal LD, normal DD, reverse LD and reverse DD, respectively. a Schematic diagram showing the light:dark regimes used in the experiments. Black box indicates dark, and light box indicates light. The sampling times used in Fig. 5b and d are indicated by lines labeled B and D, respectively. b Relative expression levels of astakine 1 in hemocytes at clock hour 7:30 and 15:00 during normal LD, normal DD, reversed LD, and reversed DD, respectively (n = 3). c Western-blot analysis of astakine1 in plasma at clock hour 7:30 and 15:00, and Quantity One analysis of membranes during normal DD, reversed LD, and reversed DD, respectively (n = 3). d Relative expression levels of astakine 1 in hemocytes at clock hour 6:00 and16:30 during reversed LD and reversed DD, respectively (n = 3). e Western-blot analysis of astakine1 in plasma at clock hour 6:00 and 16:30, and Quantity One analysis of membranes during reversed LD and reversed DD, respectively (n = 3) Asterisks indicate that the expression levels are significantly different (*p < 0.05, **p < 0.01)

