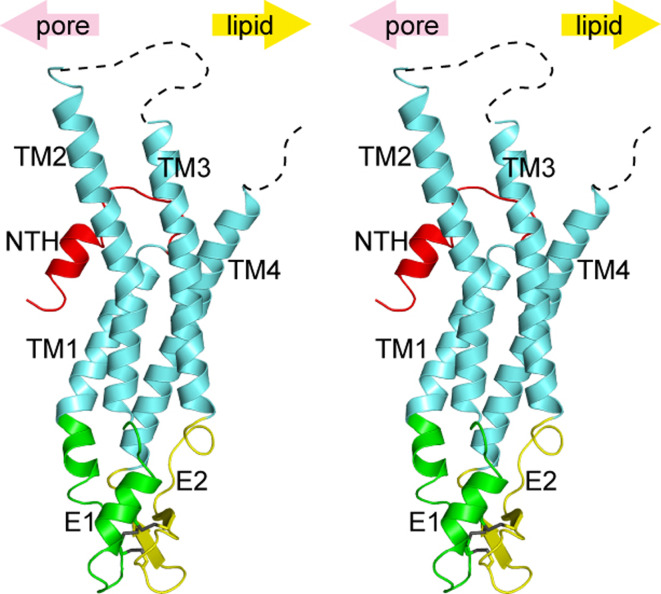
Fig. 2.
Wall-eye stereo view of the Cx26 monomer in ribbon representation. Each region is colored differently, and the upper arrows indicate the pore side and the lipid side. Three disulfide bonds in the extracellular region are shown in stick representation. Unobserved regions in the cytoplasmic loop and the C-terminal tail are represented by dashed lines

