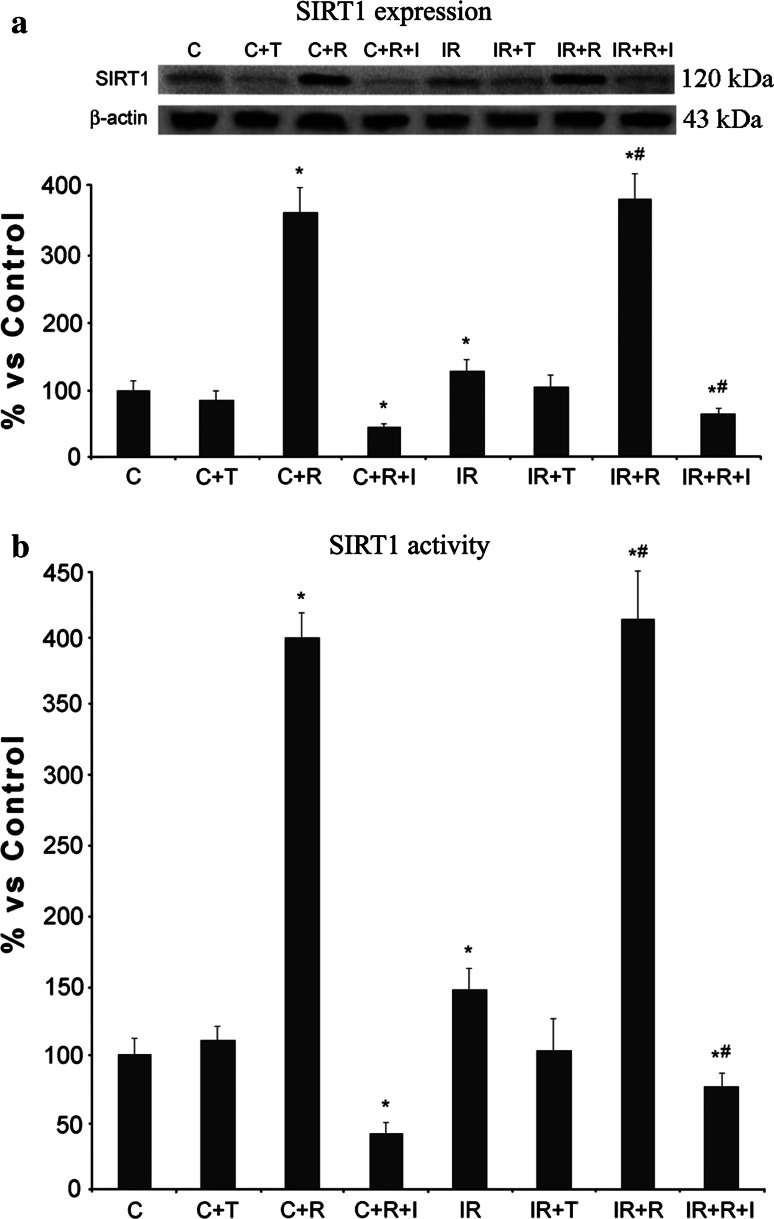
Fig. 3.
SIRT1 expression a and activity b in IR neonatal rat ventricular cardiomyocytes. In western blot analysis all signals were quantified by densitometric analysis and were expressed as a ratio of SIRT1 densitometry versus β-actin (loading control) densitometry. *Significant difference (p ≤ 0.05) versus untreated cells. #Significant difference (p ≤ 0.05) versus IR cells. Control normoxic cells (C), Resv (R), Trolox (T), SIRT1 inhibitor (I). The reported values (mean ± SD) are representative of four independent experiments, each performed in triplicate

