Fig. 8.

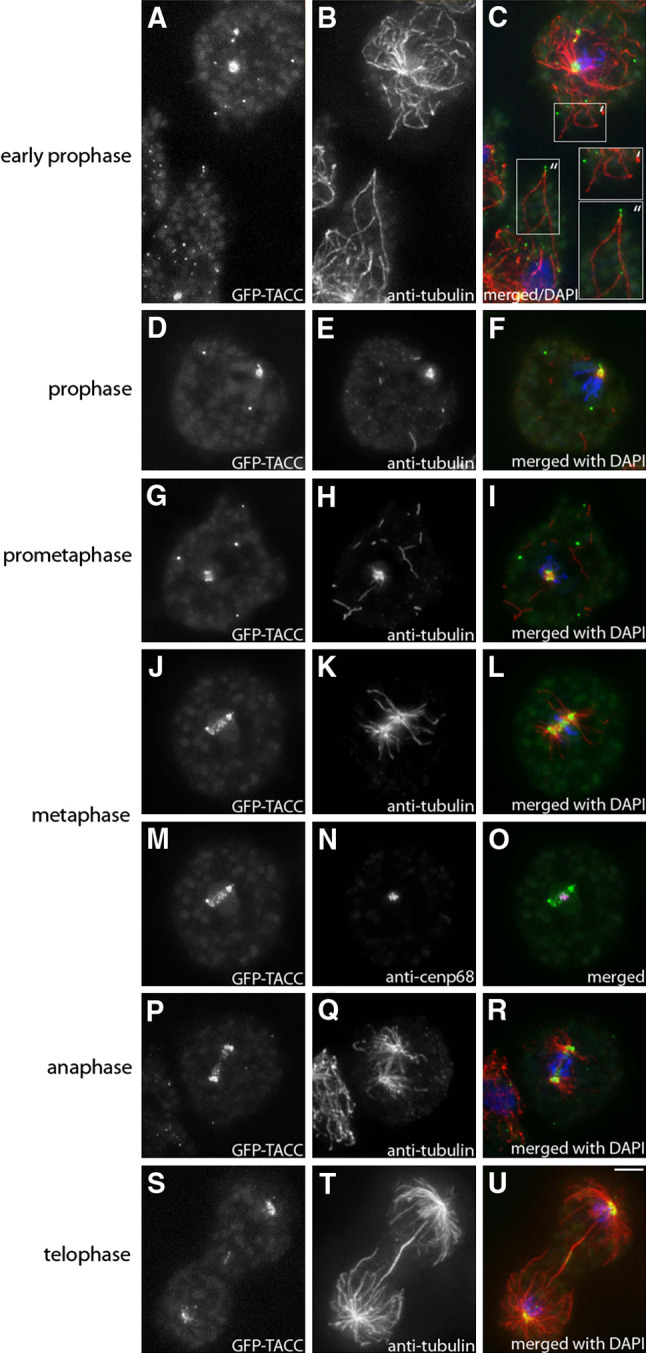
During mitosis GFP-TACC localizes to spindle poles, the kinetochores and the mid-body region but is virtually absent from tips of astral microtubules. GFP-TACC (grayscale images as indicated and green in merged images) expressing cells were fixed with glutaraldehyde and stained with anti-tubulin (grayscale images as indicated and red in merged images). To visualize the kinetochores, cells were also labeled with anti-Cenp68 as a centromere marker (N, magenta in O). DNA is shown in blue, mitotic stages are indicated on the left. In all interphase cells adjacent to the mitotic cells shown above, a clear GFP-TACC signal was visible at the microtubule plus-end tips. An example for that is shown in (c), where the upper right cell represents an early prophase stage as can be seen by its condensed DNA (′), with no GFP-TACC signal at the microtubules tips, while in an interphase cell at the lower left (″) TACC is clearly associated with microtubule plus ends. Throughout mitosis, GFP-TACCdom exhibited the same behavior as GFP-TACC (not shown). Bar 2 μm
