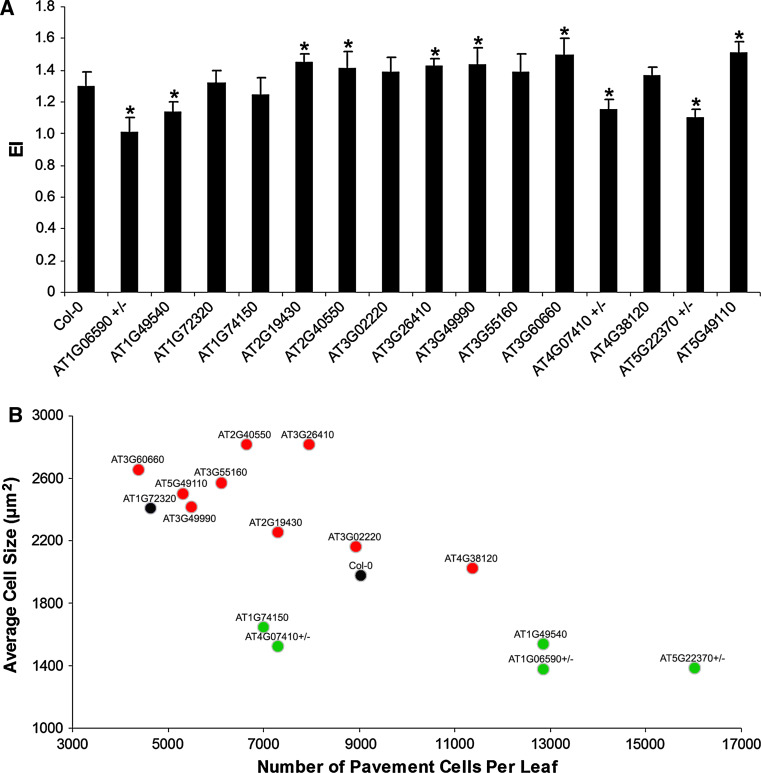
Fig. 2.
Experimental association of Arabidopsis thaliana candidate genes with cell replication. The Arabidopsis first leaf was used to measure cell division and DNA replication parameters. a The mean number of endoreduplication cycles denoted as Endoreduplication Index (EI) of the T-DNA insertion lines [*statistically different from the control (Col-0) plants, according to the t test P < 0.05 (n = 10); ± represents hemizygous mutants]. b Scatter plot of the analyzed mutants. Mutants were plotted according to their respective number of cells and cell size. Mutant lines are color-coded according to their DNA ploidy content phenotype. Green and red dots represent mutants with a reduced and increased EI, respectively

