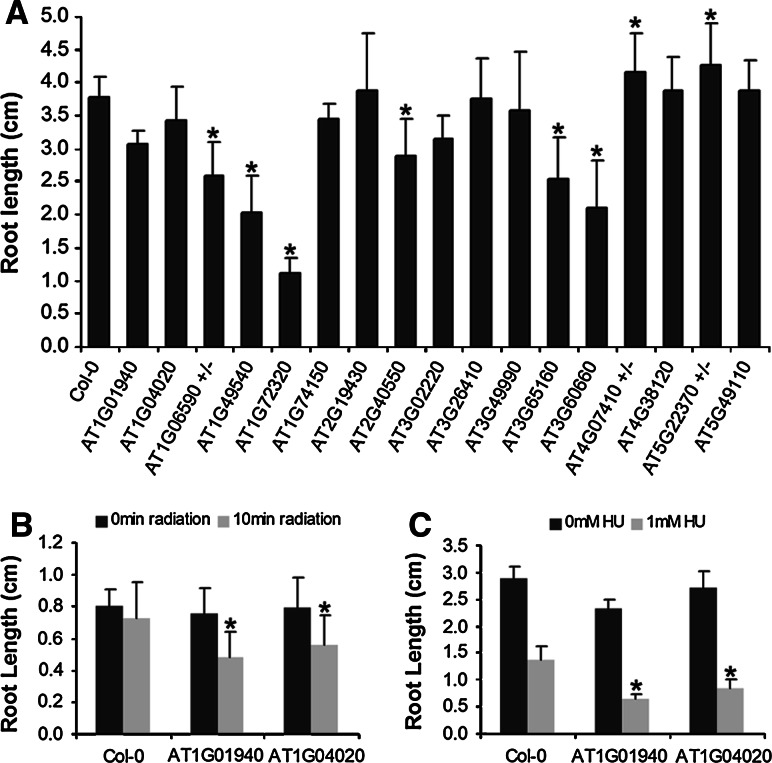
Fig. 3.
Hypersensitivity of selected T-DNA insertion lines towards DNA replication-inhibiting treatments. a Root length under standard growth conditions for the analyzed T-DNA insertion lines. Roots were measured after 7 days of growth on vertical MS plates. b, c Mutants displaying a differential root growth response upon UV-B irradiation or in the presence of 1 mM HU, respectively [*Statistically different from the control (Col-0) plants according to the t test P < 0.05 (n = 30); ± represents hemizygous mutants]

