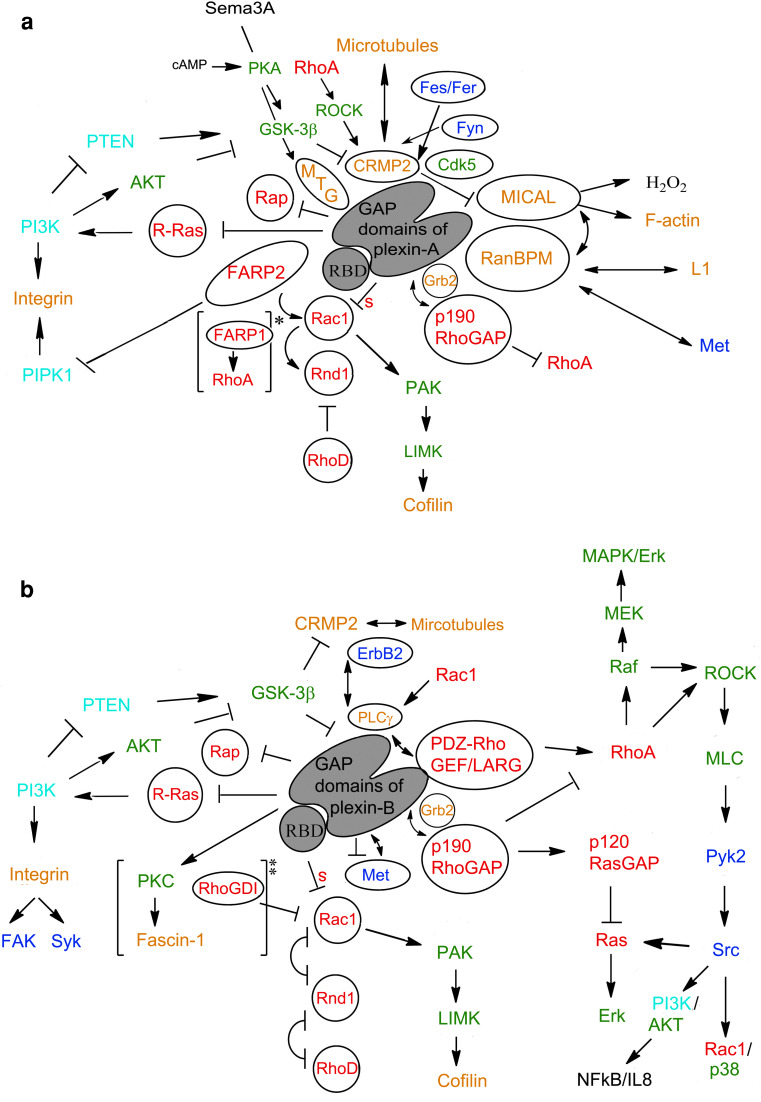
Fig. 1.
a, b Intracellular signaling networks surrounding vertebrate plexin-A and plexin-B function. Proteins that are known to directly interact with plexin-A and/or -B family members are encircled. Color scheme indicates type of protein as follows: red: GTPase or GTPase regulatory protein; blue: tyrosine kinase; green: serine/threonine kinase; light blue: enzyme involved with lipid second messenger; orange: protein functioning as adaptor, scaffold or involved with cytoskeleton [* in plexin-A4, ** in plexin-B3]. Double arrows indicate additional protein–protein interactions that may occur while bound to plexin. Single activating and inhibitory arrows pertain to the functional interaction of the two proteins involved only; e.g. R-Ras stimulates PI3K, even though in plexin signaling PI3K is downregulated because R-Ras is deactivated. Inhibitory arrow with “s” indicates a sequestration mechanism has been suggested. Cell signaling networks are not yet substantially understood for plexin-C1 and -D1. Although some common features are shared with plexin-A and -B family members, many others are likely to be distinct

