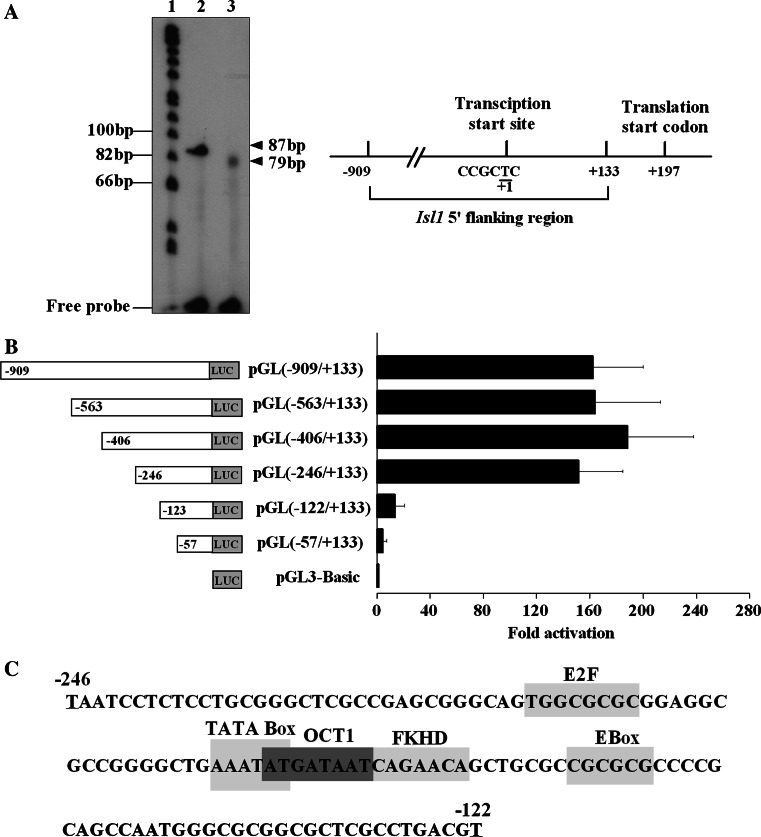
Fig. 2.
Analysis of the 5′ flanking region of Isl1 gene. a Primer extension assay was used to identify the transcriptional start site of Isl1. Lane 1 ϕ×174 Hinf1 DNA marker, lane 2 control RNA, lane 3 induced day 4 P19CL6 RNA. The arrowheads indicate the products of the primer extension from control (87 bp) and experimental groups (79 bp). The map of Isl1 transcriptional start site is shown in the right panel. b Luciferase assay was performed to evaluate the activities of Isl1 promoter and its truncated constructs. Data are shown as fold activation over that of PGL3-basic promoter with means ± SD (n = 3). c Potential binding sites of transcription factors between the nucleotide −246 and −122 are indicated by boxes

