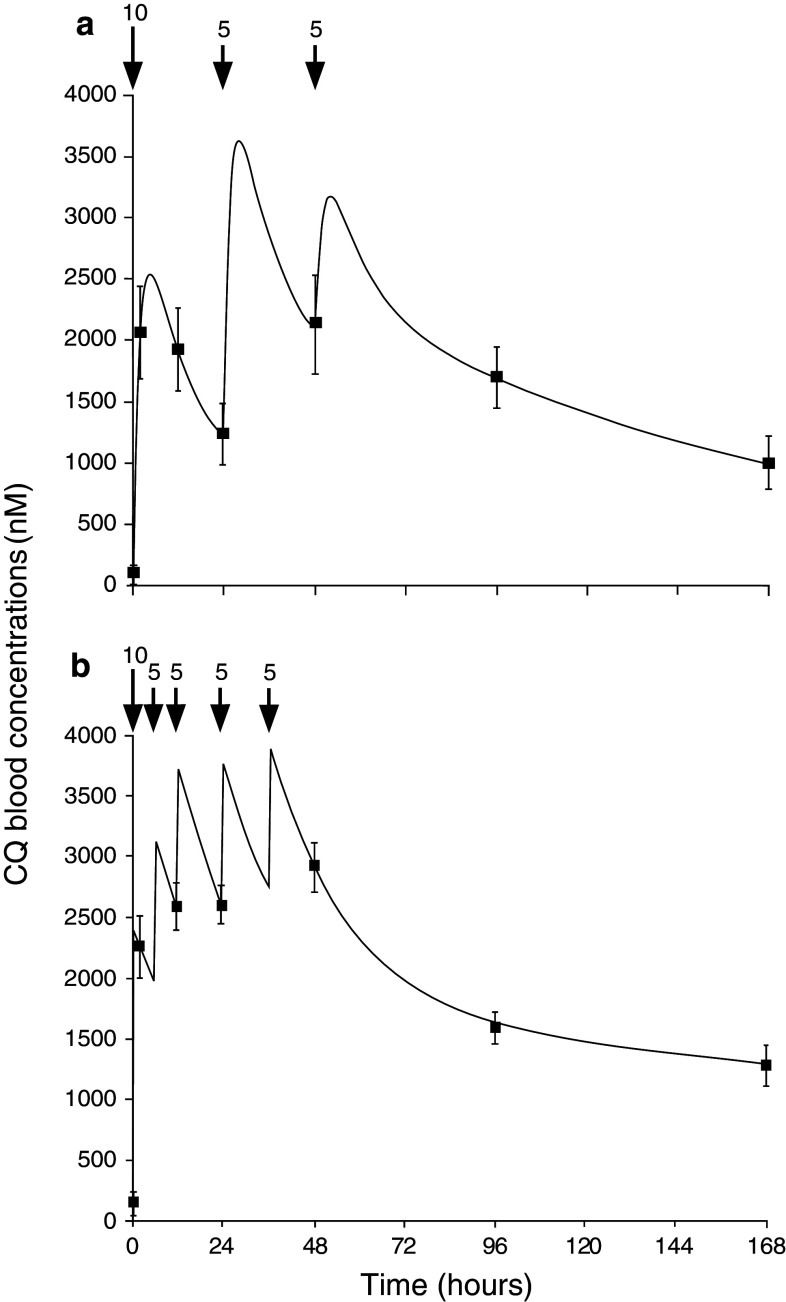
Fig. 4.
The blood concentration of CQ over time during treatment with; a the standard CQ regimen (10 mg/kg at 0 and 24 h, and 5 mg/kg at 48 h), or b under more frequent administration (10 mg/kg at 0, followed by 5 mg/kg doses at 6, 12, 24 and 36 h). Numbers above the arrows indicate CQ doses in mg/kg of body weight. More frequent dosing led to higher blood concentrations of CQ during the first 3 days of treatment. This ensured that parasites were exposed to high CQ concentrations throughout the intraerythrocytic lifecycle and resulted in improved rates of parasite clearance. Reprinted with permission from [166]

