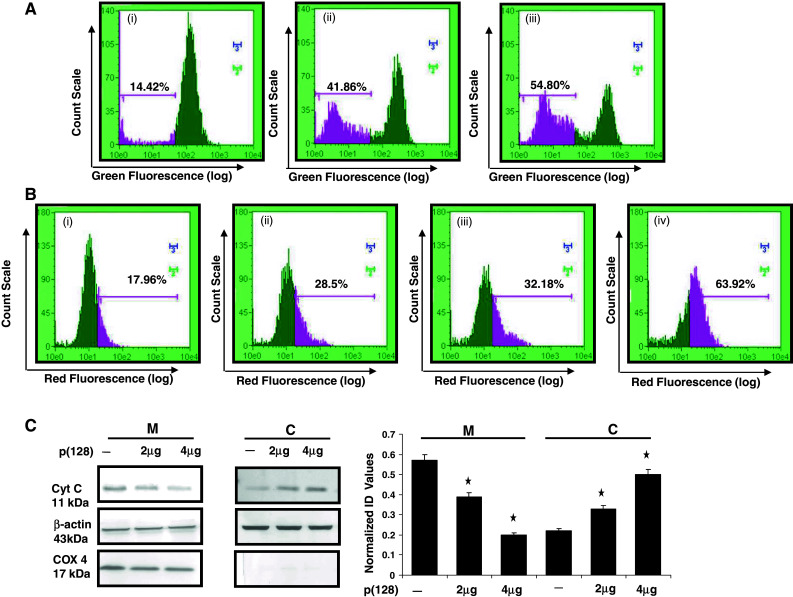
Fig. 3.

Disruption of mitochondrial membrane potential, ROS generation and release of cytochrome c in cytosol in HEK293T cells by hsa-miR-128. a ∆ψm was estimated using DiOC6. (i) Untransfected, (ii) transfected with 2 μg p(128), (iii) transfected with 4 μg p(128) for 24 h. 30 min prior to harvesting, cells were incubated with 40 nM DiOC6. After incubation, cells were harvested, and change in fluorescence was measured using flow cytometry p < 0.05 b ROS generation was checked by DHE. (i) untransfected, (ii) transfected with 2 μg p(128), (iii) transfected with 4 μg p(128) for 24 h (iv) H2O2 was used as a positive control. The illustrated histograms are representative of three independent experiments p < 0.05 with similar results. c Release of Cytochrome c from mitochondria to cytoplasm after the overexpression of miR-128. Mitochondrial and cytoplasmic fractions were separated as described in the “Materials and methods” section. C represents Cytoplasmic fraction and M represents Mitochondrial fraction. The purity of the fractions was determined by the expression of Cox 4 (mitochondrial specific protein). β-actin was used as a loading control. The protein band was quantified and normalized to β-actin intensities. Bar mean ± SEM, *p < 0.05, n = 3. Normalized ID values represent normalized integrated densitometric values
