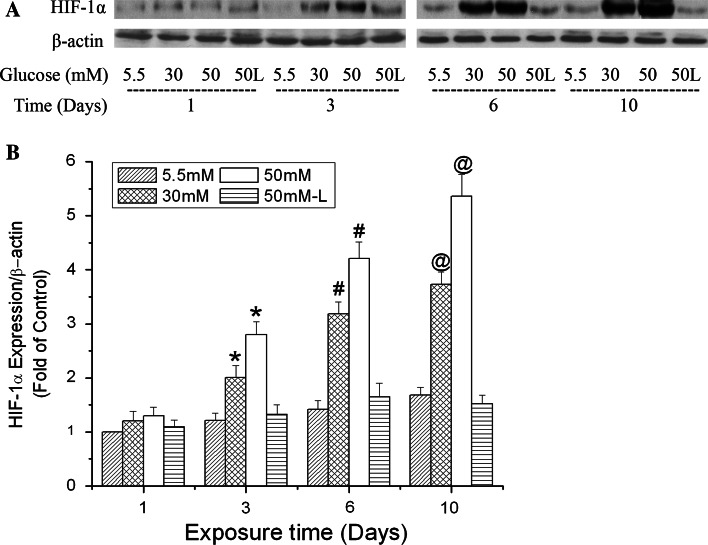
Fig. 1.
Time-dependent effects of high glucose on HIF-1α expression in b.End3 cells. Cells were treated with glucose (d-glucose unless otherwise noted) at 5.5, 30 and 50 mM for 1, 3, 6 or 10 days. l-Glucose at 50 mM in the presence of 5.5 mM d-glucose was used as osmotic control (50 L). a Representative Western blots of HIF-1α with β-actin as a protein loading control. b Summary of three independent experiments. Values were normalized to β-actin and control (5.5 mM glucose, 1 day). Data are means ± SEM, n = 3. *p < 0.05 versus 3 day control (5.5 mM glucose), # p < 0.05 versus 6 day control (5.5 mM glucose), @ p < 0.05 versus 10 day control (5.5 mM glucose)

