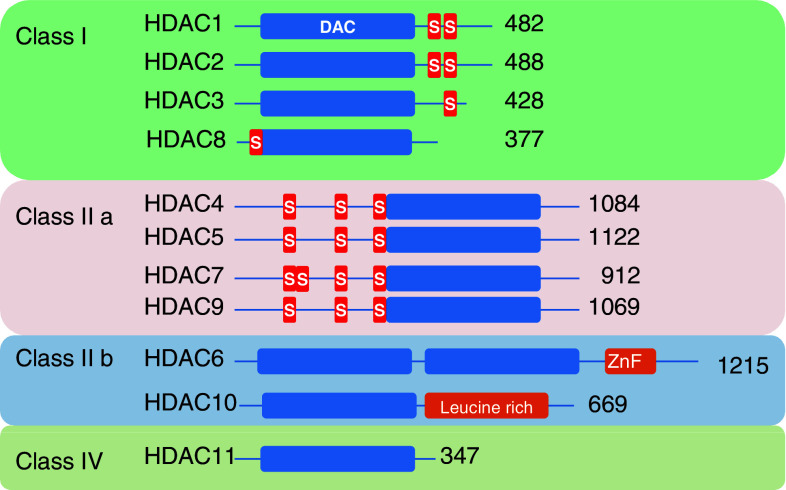
Fig. 1.
HDAC classification. The HDAC classes are indicated (class III HDACs—sirtuins—are not depicted). Blue rectangles depict the Deacetylase Domain (DAC), red rectangles indicate phosphorylation sites; Zinc finger (ZnF) and leucine rich motifs are also indicated. The numbers specify the number of amino acids

