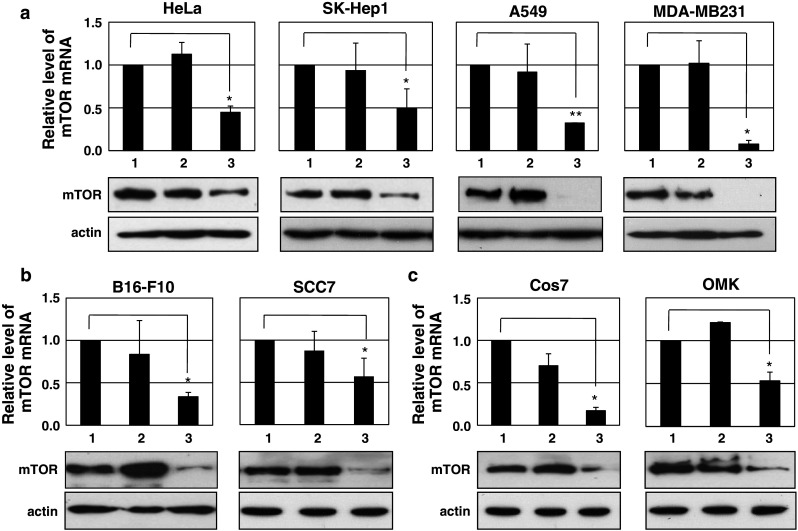
Fig. 2.

Cross-species activity of mTOR siRNA in cell lines. Cross-species effects of mTOR siRNA on mTOR gene expression were determined by real-time RT-PCR (upper panel graph; n = 3) and immunoblot analysis (lower panel; n ≥ 2) in cell lines of human (a), murine (b), and monkey (c) origin. Experimental details are provided in Fig. 1a. Lane 1 mock-treated, lane 2 control siRNA-treated, lane 3 mTOR siRNA no. 4-treated. Each value represents the mean ± SD. *p < 0.05, **p < 0.01
